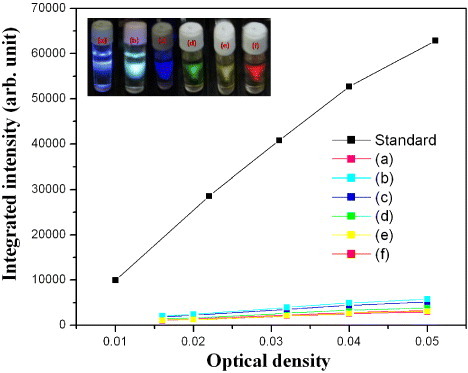
Figure 2.

Integrated intensity of luminescence excited at (a) 360, (b) 380, (c) 440, (d) 525, (e) 550 and (f) 610 nm versus optical density at that wavelength. The optical density was changed by varying the C-dot concentration. The inset shows luminescence images for samples (a)–(f). Rhodamine 6G was used as the standard.
