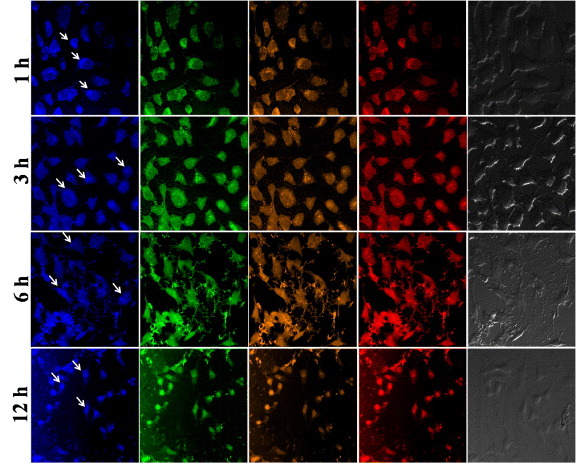
Figure 8.

CLSM images of MDA-MB-468 cells treated with C-dots after 1, 3, 6 and 12 h. Excitation and emission wavelengths: first column: λex = 359 nm, λem = 461 nm; second column: λex = 494 nm, λem = 520 nm; fourth column: λex = 570 nm, λem = 590 nm; the third column is a sum of the second and fourth columns. Scale bars: 1, 3, 6 h — 10 μm and 12 h — 20 μm.
