Abstract
Adding a large amount of light elements such as aluminum to steels is not a new concept recalling that several Fe–Al–Mn–C alloys were patented in 1950s for replacement of nickel or chromium in corrosion resistance steels. However, the so-called lightweight steels or low-density steels were revisited recently, which is driven by demands from the industry where steel has served as a major structural material. Strengthening without loss of ductility has been a triumph in steel research, but lowering the density of steel by mixing with light elements will be another prospect that may support the competitiveness against emerging alternatives such as magnesium alloys. In this paper, we review recent studies on lightweight steels, emphasizing the concept of alloy design for microstructures and mechanical properties. The influence of alloying elements on the phase constituents, mechanical properties and the change of density is critically reviewed. Deformation mechanisms of various lightweight steels are discussed as well. This paper provides a reason why the success of lightweight steels is strongly dependent on scientific achievements even though alloy development is closely related to industrial applications. Finally, we summarize some of the main directions for future investigations necessary for vitalizing this field of interest.
Keywords: 30.04, 30.05
Keywords: lightweight steel, κ-carbide, ordering, planar glide, TRIP steel, TWIP steel
1. Introduction
The development of advanced steels with high strength, good ductility and toughness has been long pursued. Typical examples of those steels are categorized as advanced high-strength steel including dual-phase steels, transformation-induced plasticity (TRIP) steels and high-manganese austenitic steels for automotive applications. In recent years, another concept of advanced steel has gained a great deal of attention led by the necessity for further reducing the vehicle weight. Traditionally, the high level of specific strength of advanced steels has been sought to be achieved mainly by increasing the strength of the steels [1–4]. An alternative way of increasing the specific strength is to make steels with lower density by alloying light elements such as Al (and/or Si) with the Fe–Mn–C-base alloy system.
Alloys of the Fe–Al–Mn–C system have been studied for several different reasons such as (i) cryogenic application, (ii) oxidation resistance application at high temperature and (iii) corrosion resistance application as a potential substitute for more expensive Fe–Cr–Ni base stainless steels [5–11]. In particular, the study of the Fe–Al–Mn–C system to replace Fe–Cr–Ni–C stainless steels [12] was active up to the 1980s, where the replacement of Cr and Ni by less expensive Al and Mn is considered [13–15]. During the last two decades, much effort has been directed towards the development of ductile lightweight steels with high strength and reduced density for structural applications. A study of the Fe–Al–Mn–C system for automotive applications has been activated since the early 2000s in Europe and Japan.
In the 2000s, Frommeyer and Brüx [16] reported high-strength Fe–Al–Mn–C lightweight alloys with excellent ductility, the so-called TRIPLEX steels. TRIPLEX steel is a kind of multiphase steel that has three major phases. It is composed of austenite as the matrix phase with 5–15 vol.% ferrite and nano-size κ-carbides less than 10 vol.%, which are finely dispersed throughout the austenite. The composition range of these steels covers Fe–(18–28)Mn–(9–12)Al–(0.7–1.2)C (in wt%). The authors of [16] added Al up to 12% (hereafter all are given in wt% unless stated otherwise) and reported a linear relationship, indicating 1.5% density reduction per Al addition of 1 wt%. Their typical alloy of Fe–28Mn–12Al–1C alloy shows a yield strength of 730 MPa, an ultimate tensile strength of 1000 MPa and total elongation of 55% during a uniaxial tensile test performed at room temperature at a strain rate of 10−4 s−1. Sutou et al [17] recently reported that cold workability of Fe–20Mn–1C–Al alloys is severely deteriorated by Al addition of more than 11 wt%. They demonstrated that Cr addition greatly enhances the cold workability even with higher contents of Al and C. With the help of Cr, they could produce Fe–20Mn–13Al–1.3C–5Cr alloy that bears a density of 6.43 g cm−3 (18.3% density reduction), a yield strength of 915 MPa, an ultimate tensile strength of 1140 MPa and total elongation of 22% during a uniaxial tensile test performed at room temperature at a strain rate of 3.3 × 10⁻⁴ s−1.
The concept of lightweight steel looks quite simple, but the underlying metallurgical issues are complicated. This is because the lightweight steel can have ferritic, austenitic or even multiphase structure depending on the content of primary alloying elements of C, Mn or Al; this complicates the deformation mechanism as well. The studies of lightweight steels have been sporadic even though impressive mechanical performances accompanying a significant density reduction were reported in many cases. There is a need for timely assessment of these emerging steels with respect to the influence of alloying elements on the phase constituents and mechanical behavior to gain a better understanding and a wider viewpoint for further alloy development, which was the goal of this study.
2. Phase constitution
Phase identification within the Fe–Al–Mn–C system dates back to the earlier work of Koster and Tonn on Fe–Al–Mn phase equilibria in 1933 [18]. After Schmatz’ 1959 discovery of β-manganese formation in Mn-rich Fe–Al–Mn–C alloys [19], the phase equilibria study was continued by Krivonogov et al [20], Ishida et al [21] and Acselrad et al [22]. Depending on the chemistry and temperature, there are reported at least five equilibrium phases in the Fe–Al–Mn–C system: γ-austenite, α-ferrite, κ-carbide, M3C carbide (θ) and β-Mn. κ-carbide is L12 ordered fcc carbide of the type (Fe, Mn)3AlC [12]. Recently, Chin et al [23] and Lee et al [24] constructed a CALPHAD-type thermodynamic description for the Fe–Al–Mn–C quaternary system by combining a newly assessed Mn–Al–C ternary description and a partly modified Fe–Al–C one with the existing thermodynamic database.
The matrix phase of low-density steels based on a Fe–Al–Mn–C system can be either ferrite, austenite or a mixture of ferrite and austenite depending on the content of austenite stabilizing elements of C and Mn. Phase diagrams for Fe–5Mn–(0–9)Al are calculated based on the CALPHAD approach [23] and reproduced as a function of carbon at various temperatures from 500 to 1200 °C in figure 1. At 0% Al, as shown in figure 1(a), austenite has a single-phase region in a wide C range from 0 to 1.9% at high temperature, but exists along with ferrite and cementite (θ) at lower temperatures. A eutectoid reaction for austenite decomposition to a lamellar ferrite and cementite microstructure occurs at approximately 0.6% C. A phase diagram with 3% Al in figure 1(b) shows a reduced austenite single-phase region; the increased Al content raises the stability of ferrite and suppresses the formation of an austenite single-phase region at low C content below 0.16%. However, with 3% Al, κ-carbide is observed at low temperature on the high carbon side. κ-carbide is present up to 650 °C at 2.0% C. Increasing the Al content to 6% resulted in a further decrease in the stability of austenite to higher temperatures and higher C content in figure 1(c). The higher Al content also increased the stability of κ-carbide to higher temperatures and lower C content at the expense of cementite stability. A eutectoid reaction for austenite decomposition to lamellar ferrite and κ-carbide microstructure occurs at approximately 1% C. As the Al content increased to 9%, the austenitic region is limited to higher C concentrations and higher temperatures while κ-carbide stability increased and replaced cementite in the whole C range at low temperature as shown in figure 1(d).
Figure 1.
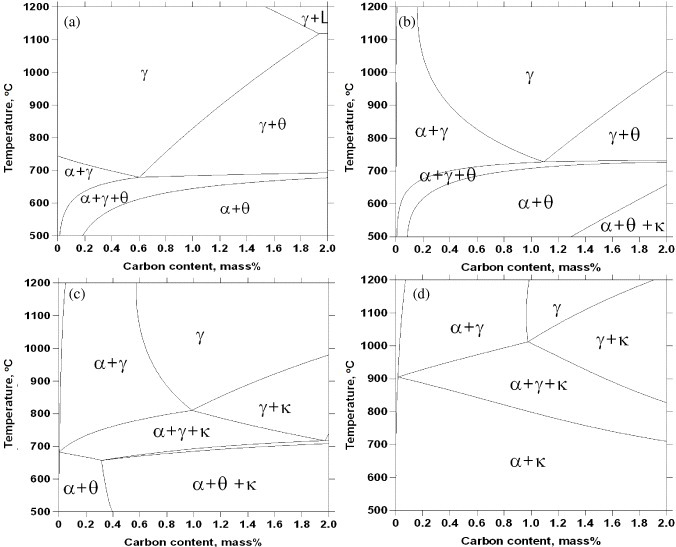
Phase diagrams of Fe–5Mn–(0–9)Al–C alloys calculated based on the CALPHAD approach (adapted using data from [23]). Phase boundaries show γ-austenite, α-ferrite, θ-cementite and κ-carbide (at a fixed 5% Mn concentration) as a function of carbon content at Al concentrations of (a) 0%, (b) 3%, (c) 6% and (d) 9%.
Ishida et al [21] investigated Fe–Al–Mn–C alloys with an Mn content of 20%, which were equilibrated at 900–1200 °C using isothermal treatment up to 210 h. Figure 2 shows the isotherms of phase relations in Fe–20Mn–Al–C alloys at 900 and 1000 °C calculated based on the CALPHAD method [23], in comparison with the experimental results of [21]. Although the agreement is not perfect, the influence of C and Al contents on the constituent phase, in particular the stability of the κ carbide, is reproduced fairly well. At 900 °C, C content of 0–2.3% and Al content of 0–9% produce a fully austenitic microstructure. Cementite was observed to be stable at Al concentrations less than 5.6%. Generally speaking, from figure 2, austenite is stable for low Al and high C concentrations and the stability of κ-carbide is secured at high C and high Al contents. Cementite is preferred at high C and low Al levels and ferrite is stable at high Al and low C compositions.
Figure 2.
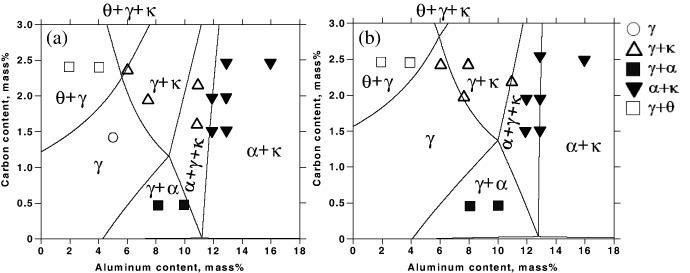
Phase relations in Fe–20Mn–Al–C alloys (a) at 900 °C and (b) 1200 °C calculated based on the CALPHAD approach (adapted using data from [23]), in comparison with experimental information [21].
2.1. Classification of Fe–Al–Mn–C lightweight alloys
Depending on the matrix phase constituents, Fe–Al–Mn–C lightweight alloys can be classified into three categories: (i) ferritic steels [25–27], (ii) duplex steels [28–31] and (iii) austenitic base steels [16, 17, 32–34] as summarized in table 1. Fe–Al base ferritic low-density alloys can contain medium Mn of 6–8% [35]. This type of alloy can have either disordered A2 α-(Fe, Al), B2-ordered FeAl or DO3-ordered Fe3Al as the dominant phase. They have considerable potential as structural materials for high-temperature applications. But a lack of ductility at ambient temperatures with an increase of Al content to above 6–8% limits the applicability due to onset of long-range ordering between Fe and Al. Further increase of Al content results in the formation of Fe–Al base intermetallic compounds such as DO3-Fe3Al and B2-FeAl [36].
Table 1.
Microstructure constituents in lightweight alloys (approximate ranges in wt%).
| Ferrite based | Duplex | Austenite based |
|---|---|---|
| (5–8)Al, (0–0.3)C, (0–8)Mn | (3–10)Al, (0.1–0.7)C, (5–30)Mn | (8–12)Al, (0.5–1.2C), (15–30)Mn |
| Ferrite+κ-carbide (κ-carbide precipitates when C and Mn are added) | Austenite+ferrite+κ-carbide | Austenite+κ-carbide |
The strength of austenitic and duplex steels based on the Fe–Al–Mn–C system can be increased by uniform precipitation of κ-carbide during ageing at temperatures below 650 °C. Solution treatment prior to ageing is typically performed at temperatures above 1000 °C [12, 16, 20, 21, 37–40]. The quenched microstructure is either austenite or a duplex microstructure of austenite and ferrite. In wrought Fe–Al–Mn–C alloys, the austenite shows an equiaxed grain structure containing annealing twins [16]. In wrought duplex alloys, ferrite stringer bands appear parallel to the rolling direction [28].
2.2. Carbide precipitation
The common practice for age hardening is an isothermal holding for 10–20 h in the temperature range 500–650 °C [16, 37, 41]. At an optimum ageing temperature of 550 °C, finely dispersed coherent carbides are precipitated with a diameter of about 10 nm, which are resistant to coarsening at this temperature [20, 42]. Sato et al [40] revealed that κ-carbide precipitation requires the diffusion of both C and Al in austenite. Figure 3 shows the effect of chemical composition on the κ-carbide precipitation. Two alloys, Fe–29Mn–4.9Al–0.98C and Fe–34Mn–7.1Al–0.5C, did not age harden for ageing times up to 2000 min at 550 °C but Fe–34Mn–11Al–0.98C and Fe–31Mn–7.8Al–0.88C alloys having higher contents of Al or C exhibited remarkable age hardening. No κ-carbide precipitation was observed in the former alloys, which implies that the chemical driving force for the precipitation is not enough with a deficiency of either Al or C.
Figure 3.
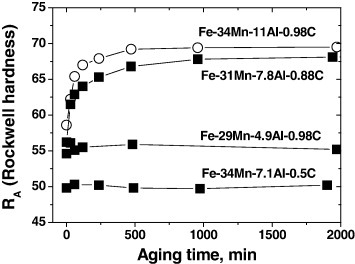
Effects of chemical composition on hardness curves are shown as a function of ageing time at 550 °C. The alloys containing the lowest aluminum (Fe–29Mn–4.9Al–0.98C) and/or lowest carbon (Fe–34Mn–7.1Al–0.5C) do not age harden (adapted using the data from Sato et al [40]).
According to Ishida et al [21], a metastable fully austenitic microstructure can be obtained in Fe–(25–30)Mn–Al–C alloys after solution treatment above 900 °C followed by quenching to room temperature as long as the Al content is less than 10% and the C concentration is 0.8–1.4%. Ishida et al [21] did not find κ-carbide precipitates in the metastable austenitic microstructure by optical microscopy. However, Bentley [42] observed austenite decomposition showing an L12 ordering diffraction pattern using transmission electron microscopy (TEM) in Fe–32Mn–11Al–(0.8–1.0)C sheets, which were solution-treated at 1000 °C and rapidly cooled by oil-quenching or brine quenching. The diffraction pattern is identical to those observed in well-developed carbides after ageing. He suggested that the initial stage of austenite decomposition in Fe–Al–Mn alloys containing 0.8–1% C occurs during the quenching from the solution treatment temperature, and that subsequent carbide precipitation is not a result of nucleation and growth at the ageing temperature. The idea of precipitation of κ-carbide during cooling after solution treatment is also supported by Lin et al [43] and Sutou et al [17]. Sutou et al observed the κ-carbide in solution-treated Fe–20Mn–Al–C alloys, when C and Al contents are greater than 1.8 and 11%, respectively. It may be safe to conclude that κ-carbide can precipitate even during rapid cooling from solution treatment provided that the driving force for precipitation is sufficient. Some researchers proposed [39, 44] that a spinodal reaction causes modulation of Al and C in the austenite. The localized chemical potential from the modulation may enhance the formation of a metastable L12 precipitate that then transforms to the E21 κ-carbide by C ordering. However, direct evidence for the L12 precursor reaction has not been reported in the literature.
3. Influence of alloying elements on mechanical properties
Since an intensive review by Howell et al [45] is available for the mechanical properties of age hardening Fe–Al–Mn–C alloys, we have limited our focus on the mechanical property issues in solution-treated and/or annealed wrought sheet products which is compatible with the processing conditions of automotive steel. Figure 4 summarizes the mechanical properties of Fe–Al–Mn–C-based lightweight alloys in terms of tensile strength and total elongation. Data for Fe–Al ferritic alloys [9, 16] were reported by tensile tests carried out at strain rates ranging from 10−4 to 10−2 s−1. All the data [9, 13, 16, 17, 29, 33, 46] are from solution-treated and water-quenched specimens except for high-Al TRIP steels [28, 30], which were annealed at around 800 °C after cold rolling. In austenitic and duplex steels, open symbols stand for the air cooling after solution treatment at 1100 °C. Solution treatment for all data was carried out at temperatures ranging from 1000 to 1100 °C. The isothermal holding time at 1000 and 1100 °C was 1–2 h and 10–15 min, respectively. A tensile test was performed at strain rates ranging from 10−4 to 10−3 s−1 at ambient temperature.
Figure 4.
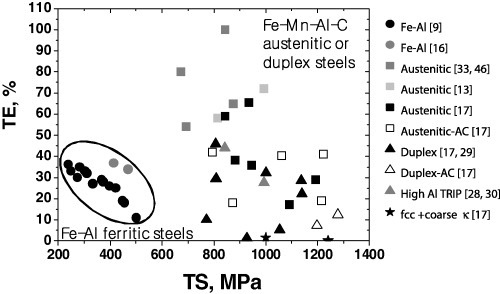
Total elongation in tension as a function of the ultimate tensile strength in Fe–Al–Mn–C-base alloys. All the data are from solution-treated and water-quenched specimens except for high-Al TRIP steels, which were annealed at around 800 °C after cold rolling, among austentic and duplex steels. Open symbols stands for the air cooling after solution treatment at 1100 °C. (TS and TE stand for ultimate tensile strength and total elongation, respectively.)
Fe–Al base ferritic alloys exhibit lower strength and lower total elongation when compared with austenitic and duplex steels. In austenitic and duplex steels, single-phase austenitic steels show higher total elongation than duplex steels, while the strength levels are almost similar. Austenitic single-phase steels subjected to water quenching after solution treatment are characterized by a high tensile ductility. When austenitic and duplex steels are air-cooled, the strength increases at the expense of ductility. With the formation of coarse κ-carbides in an austenitic matrix, the alloys did not show any tensile elongation irrespective of the strength levels.
3.1. Effect of carbon content
The effect of C content on the mechanical properties of Fe–Al–Mn–C alloys is presented in figure 5. Specimens were solution-treated before oil or water quenching. Figure 5(a) shows mechanical property changes in Fe–(28–30)Mn–(8.5–9.4)Al–C alloys [43, 46, 48]. The strength of the alloys increases with increasing C content. Interestingly, it is insensitive to the change of constituent phase. Yield strength increases at a higher rate than the ultimate tensile strength, indicating a gradual decrease of strain hardening potential with increasing C content. Total elongation increases until the matrix becomes single-phase austenite and then decreases rapidly with increasing C content after a maximum peak at 0.8% C. The abrupt deterioration of ductility may be related to the κ-carbide precipitation (or ordering) upon cooling after solution treatment. Once a single austenitic phase is obtained, excess carbon may fertilize the κ-carbide precipitation during cooling by increasing the driving force. Figure 5(b) shows the mechanical properties of Fe–20Mn–(9–10)Al–C alloys [17, 29] as a function of C content. Although the Mn content is greatly reduced to 20%, general trends of mechanical properties are comparable with Fe–(28–30)Mn–(8.5–9.4)Al–C alloys except that a single austenite matrix appears at C content around 1% where the maximum total elongation appears. The shifting peak position from 0.8 to 1.0% C in figures 5(a) and (b) can be rationalized by the difference of austenite stability originating from dissimilar Mn content.
Figure 5.
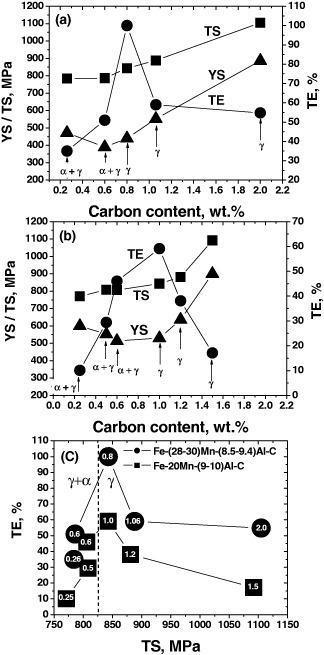
Effect of carbon content on the mechanical properties of Fe–Al–Mn–C alloys. Alloys were solution-treated and rapidly cooled by oil quenching or water quenching. (a) Fe–(28–30)Mn–(8.5–9.4)Al–C alloys [43, 46, 48], (b) Fe–20Mn–(9–10Al)–C alloys [17, 29] and (c) the alloys in panels (a) and (b). Numbers in the symbols stand for the carbon content in wt%. (YS, TS and TE stand for yield strength, ultimate tensile strength and total elongation, respectively.)
Figure 5(c) rearranges the mechanical properties in figures 5(a) and (b). Numbers in the symbols stand for the C content in wt%. Compared with Fe–20Mn–(9–10)Al–C alloys, Fe–(28–30)Mn–(8.5–9.4)Al–C alloys show better total elongation at the same strength level. However, it is noted that the reported total elongations are very sensitive to the strength level. For example, the alloy with higher Mn content exhibits 40% better elongation than that with lower Mn content at a tensile strength around 850 MPa. But with a slight increase of tensile strength by 50 MPa, both alloys show almost the same total elongation for different Mn contents. In the carbon range considered, a general trend indicates that increasing the Mn content has a beneficial effect on the mechanical balance but a more detailed investigation is thought to be necessary.
3.2. Effect of aluminum content
The effect of Al content on the mechanical properties of Fe–Al–Mn–C alloys is shown in figure 6 [13, 17, 25, 33]. All the alloys were solution-treated at temperatures above 1000 °C before water quenching. Tensile tests were carried out at strain rates from 3.3 × 10⁻⁴ to 1 × 10⁻³ s−1 at room temperature. Figure 6(a) shows the change of mechanical properties in Fe–(20–22)Mn–0.6C–Al alloys [17, 33] and Fe–Al ferritic alloys [25] as a function of Al content. In binary Fe–Al ferritic alloys, an increase of Al content resulted in the increment of strength at the expense of total elongation. In Fe–(20–22)Mn–0.6C–Al alloys, the constituent phase has changed from a single austenite to a duplex microstructure consisting of austenite and ferrite as the Al content increases over 10%. However, the trend in the change of mechanical properties with Al content is not susceptible to the change in constituent phase. Al addition increased the strength while decreasing the ductility in ferritic, austenitic and duplex steels for Al contents ranging from 3 to 13%. The abrupt decrease in the ultimate tensile strength with Al content of 0–3% is attributed to a suppression of mechanical twinning caused by the increase of stacking fault energy. The tensile strength increases in Fe–(20–22)Mn–0.6C–Al alloys with increasing Al content over 3%. This is possibly due to the fact that the deformation mechanism is changed from twinning to planar glide originating from the shearing of ordered particles. This will be further discussed in the following section.
Figure 6.
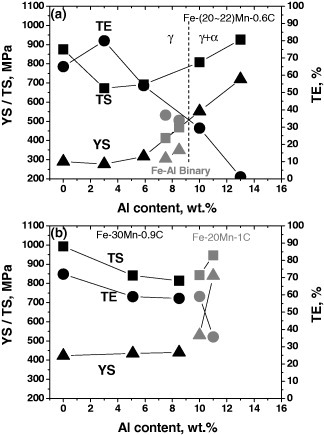
Effect of aluminum content on the mechanical properties of Fe–Al–Mn–C alloys. (a) Fe–(20–22)Mn–0.6C–Al alloys [17, 33] and Fe–Al single-phase ferritic alloys [25]. (b) Single-phase austenitic Fe–(20, 30)Mn–(0.9, 1)C–Al alloys [13, 17]. Fe–Al–Mn–C alloys were solution-treated at temperatures above 1000 °C and water quenched. Tensile tests were carried out at strain rates from 3.3 × 10⁻⁴ to 1 × 10⁻³ s−1 at room temperature.
Figure 6(b) shows the change of mechanical properties of single-phase austenitic Fe–30Mn–0.9C–Al and Fe–20Mn–1C–Al alloys [13, 17] as a function of Al content. Compared with Fe–(20–22)Mn–0.6C–Al alloys, both alloys presented in figure 6(b) show the single-phase austenitic matrix in the whole Al range considered owing to higher contents of C and Mn. It is interesting that there is continuity between the mechanical behavior of Fe–30Mn–0.9C–Al alloys and Fe–20Mn–1.0C–Al alloys with respect to the Al content despite a remarkable difference in Mn content. This seems to be contrary to figure 5(c) that indicates a beneficial influence of Mn on total elongation. However, as mentioned, such an effect of Mn is very sensitive to the strength level, so a direct comparison will be difficult. Propensity of mechanical properties is comparable with Fe–(20–22)Mn–0.6C–Al alloys, indicating that the ultimate tensile strength has gradually decreased to show a minimum, followed by increasing, although the Al content with the lowest tensile strength is shifted when compared to figure 6(a). Meanwhile, figures 5 and 6 indicate an increase of strength and a deterioration of ductility beyond certain levels of C and Al. This possibly signifies the importance of controlling the chemical driving force of κ-carbide precipitation (or ordering), which was mentioned in the previous section, for a material design with optimum mechanical properties.
3.3. Effect of manganese content
The effect of Mn content on the mechanical properties of Fe–10Al–1C–Mn (solid symbols) [17, 48] and Fe–3Si–3Al–Mn (open symbols) [4] alloys is shown in figure 7. All the alloys were solution-treated at temperatures above 1000 °C, followed by water quenching. Tensile tests were carried out at strain rates ranging from 1 × 10⁻⁴ to 3.3 × 10⁻⁴ s−1 at room temperature.
Figure 7.
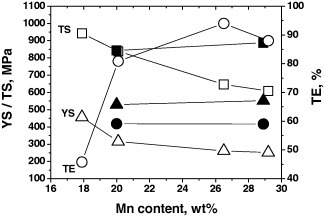
Effect of manganese content on the mechanical properties of Fe–10Al–1C–Mn (solid symbols) [17, 48] and Fe–3Si–3Al–Mn (open symbols) [4]. All the alloys were solution-treated at temperatures above 1000 °C and water quenched. Tensile tests were carried out at strain rates from 1 × 10⁻⁴ to 3.3 × 10⁻⁴ s−1 at room temperature.
Fe–3Si–3Al–Mn (open symbols) and Fe–10Al–1C–Mn (solid symbols) alloys showed dissimilar behavior with Mn addition. With an increase in the Mn content, Fe–3Si–3Al–Mn (open symbols) alloys showed a ductility increase accompanied by a decrease of strength. These austenitic alloys show a transition from the TRIP to TWIP (twinning-induced plasticity) phenomena with increasing Mn content due to an increase of stacking fault energy, resulting in high ductility at the expense of yield strength and strain hardening rate. With increasing Mn content from 20 to 29%, Fe–10Al–1C–Mn (solid symbols) austenitic alloys showed virtually no change in the mechanical properties. This implies that Mn has little influence on the driving force of κ-carbide formation in Fe–Al–Mn–C austenitic alloys.
3.4. Effect of chromium addition
The effect of Cr addition on the mechanical properties of Fe–20Mn–11Al–1.8C (solid symbols) [17] and Fe–20Mn–10Al–1.5C (open symbols) [17] alloys is presented in figure 8. All the alloys were solution-treated at 1100 °C for 15 min before water quenching. The matrix phase was austenite. Tensile tests were performed at a strain rate of 3.3 × 10⁻⁴ s−1 at room temperature. It is quite evident from figure 8 that Cr addition to Fe–Al–Mn–C alloys resulted in an increase of ductility and a decrease of strength in both alloys. This is due to the suppression of κ-carbide precipitation by Cr addition. The idea is supported by microstructural observation of Sutou et al [17], which revealed that the austenite/(austenite + κ-carbide) phase boundary shifted toward the high C side by the addition of Cr.
Figure 8.
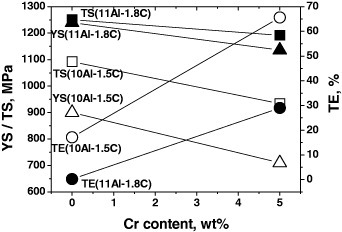
Effect of chromium addition on the mechanical properties of Fe–20Mn–11Al–1.8C alloy (solid symbols) [17] and Fe–20Mn–10Al–1.5C alloy (open symbols) [17]. All the alloys were solution-treated at 1100 °C for 15 min and water quenched. Tensile tests were performed at 3.3 × 10⁻⁴ s−1 at room temperature.
4. Effect of alloying elements on the density of austenitic steels
Frommeyer and Brüx [16] investigated the reduction in density as a function of Al and Mn. In the range of Mn content from 14 to 28%, a linear reduction in density has been mapped out as a function of Al concentration. The overall density reduction of the coexisting austenitic and ferritic Fe(Mn, Al) solid solutions was analyzed based upon the combined effect of the lattice dilatation and the average molar mass of the alloys. They showed that the Mn addition had little impact on density as compared to Al. In their paper, the contribution of C was not mentioned. Also, the density reduction in each phase of ferrite or austenite was not separately analyzed.
In 1984, Charles et al [49] systemically determined the austenitic lattice parameter of Fe–Al–Mn–C alloys using x-ray diffraction as a function of chemical composition. For the alloys in the composition range of (20–40)% Mn, (0–5)% Al and (0–1)%C, the austenitic lattice parameter was chosen as
Based on the above experimental data, we assessed the effect of each element on the density of austenitic steels. The results are shown in figures 9(a)–(c). The amounts of Mn, C and Al are found to have linear relationships with the density. From the slope of the density versus alloy content, the effectiveness of each element on the density reduction can be estimated. As Frommeyer and Brüx [16] have reported, Mn addition had very little impact on density compared with Al (−0.0085 g cm−3 per 1% Mn and −0.101 g cm−3 per 1% Al). However, from figure 10(b), it was found that C is very effective in density reduction (−0.41 g cm−3 per 1% C). By a linear combination of the influences from each element, the density of Fe–Al–Mn–C austenitic alloys can be formulated as
The densities of austenitic steels were calculated using equation (2) and were compared with the experimental data based on x-ray diffraction in figure 9(d). Both showed fairly good agreement in a wide range of densities, validating the applicability of equation (2).
Figure 9.
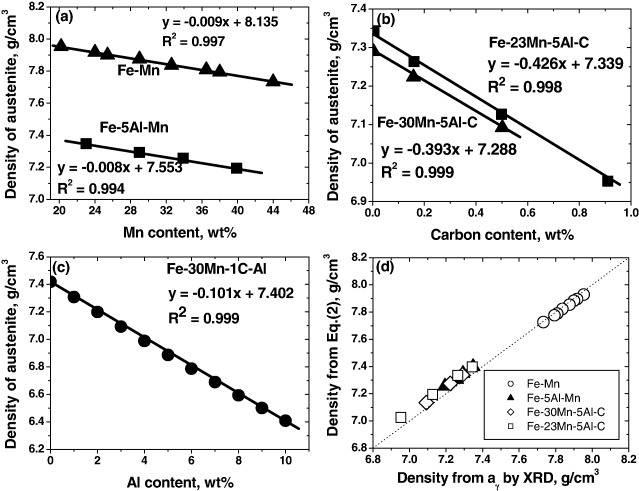
Density of austenite assessed based on the lattice parameter decided by Charles et al [49]. The effect of each alloying element is shown in panels (a)–(c): (a) manganese, (b) carbon and (c) aluminum. Densities from equation (2) are compared with those from the lattice parameter using XRD (x-ray diffraction) in panel (d).
Figure 10.
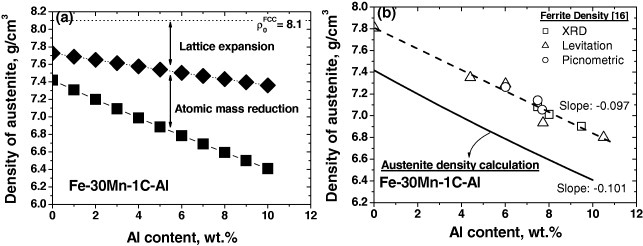
Density as a function of the aluminum content. (a) Austenitic density of Fe–30Mn–1C–Al alloys calculated by equation (2) with different aluminum contents (0–10%). The lower linear curve represents the overall decrease in density. The upper one shows the density reduction due to the lattice dilatation of austenite. (b) The calculated density of Fe–30Mn–1C–Al austenitic alloys is compared with the density of Fe–Al ferritic alloys [16].
The density of Fe–30Mn–1C–Al austenitic alloys was calculated using equation (2) and plotted as a function of Al content in figure 10(a). The lower linear curve represents the overall decrease in density. The upper one shows the density reduction due to the lattice dilatation of austenite. Figure 10(b) compares the calculated density of austenitic Fe–30Mn–1C–Al alloy with the measured density of Fe–Al ferritic alloys [16]. Although the density of austenitic Fe–30Mn–1C–Al alloys is much lower than that of Fe–Al ferritic alloys due to substantial contents of C and Mn, the effectiveness of Al in density reduction is almost the same in ferritic and austenitic alloys, since the slopes of the two curves for ferritic and austenitic alloys are nearly identical.
5. Deformation mechanism
5.1. Austenitic steels
Deformation behavior of austenitic steels is strongly dependent on the stacking fault energy as summarized in table 2. Strain-induced martensitic transformation and mechanical twinning are deformation mechanisms competitive with dislocation glide. Strain-induced martensitic transformation is known to be dominant when the stacking fault energy of austenite is less than about 20 mJ m−2 [50, 51]. As stacking fault energy increases over 20 mJ m−2, mechanical twinning is likely to control the deformation.
Table 2.
Deformation behavior of austenitic alloys.
| Stacking fault energy (mJ m−2) | Less than ∼20 | About 20–40 | Larger than ∼30 |
|---|---|---|---|
| Primary deformation mechanism | Martensite formation | Twinning | Dislocation gliding (planar gliding is observed in many high-Al steels) |
Frommeyer et al [25] reported the transition of deformation behavior from TRIP to TWIP in Fe–3Si–3Al–Mn alloys with increasing the Mn content from 15 to 25%. At 15–20% Mn concentrations, there was a strong contribution from the strain-induced martensitic transformation (γfcc → εhcp →α′). With an increase of Mn content up to 22%, the stacking fault energy increased and mechanical twinning became a major deformation mechanism. Lai and Wan [52] observed a decrease of mechanical twinning by adding 7% Al to Fe–(29.2–30.1)Mn–(0.81–0.95)C alloys, which led to an increase of stacking fault energy.
When the stacking fault energy is higher than 30–40 mJ m−2, the formation of a dislocation cell is found during deformation of high-Mn alloys [53]. The dislocation cell is generally observed during deformation of fcc materials with high stacking fault energy due to active cross slip. When fcc materials with a low stacking fault energy are deformed, uniform distributions of dislocations are commonly exhibited by planar glide [54]. However, many Fe–Al–Mn–C austenitic alloys deform by planar dislocation glide rather than wavy glide in spite of a high stacking fault energy [16, 32, 33, 46]. Fe–28Mn–12Al–1C alloy subjected to ageing for 16 h at 550 °C showed shear bands by planar glide even with a calculated stacking fault energy of 110 mJ m−2 [16]. Park et al also reported that solution-treated Fe–28Mn–9Al–0.8C alloy deformed in planar dislocation glide despite the calculated stacking fault energy of 85 mJ m−2 [46].
Frommeyer and Brüx [16] proposed that the occurrence of planar glide in Fe–Al–Mn–C alloy with a high stacking fault energy originated from the presence of nano-sized κ-carbide precipitates. Park et al [33] and Park [47] attributed the planar glide mode of deformation to the glide softening phenomenon associated with short-range ordering in the solid solution state. Recently, Choi et al [32] showed that the planar slip observed in the austenitic Fe–28Mn–9Al–0.8C alloy containing κ-carbide precipitates is mainly due to the shearing of κ-carbide precipitates by dislocations. Figure 11 shows that the κ-carbide precipitates are sheared by the slip bands.
Figure 11.
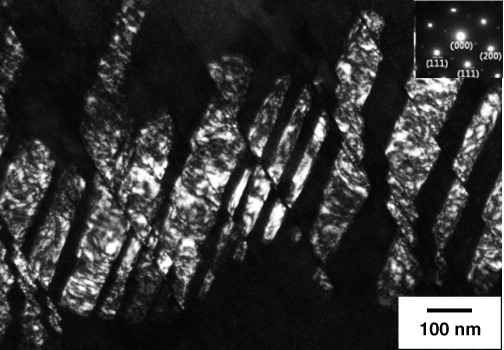
TEM dark-field image showing the shearing of κ-carbide particles by slip band [32] (reproduced with permission from [32] ©2010 Elsevier).
5.2. Duplex (α + γ) steels
Hwang et al [29] recently reported the deformation behavior of Fe–20Mn–9Al–0.6C alloy with duplex microstructure of ferrite and austenite. They showed that planar glide dominantly occurred in austenite even with the relatively high stacking fault energy of around 70 mJ m−2. Neither mechanical twinning nor strain-induced martensitic transformation occurred in austenite during tensile deformation. Ferrite exhibited the dislocation cell structure that is typically observed by the wavy dislocation glide in materials.
5.3. Duplex (δ-ferrite + γ) TRIP steels
The so-called lightweight TRIP steels have a duplex microstructure comprising δ-ferrite and austenite owing to low C content (0.1–0.4%) and medium contents of Mn (3–6%) and Al (3–6%) alloying (see the phase diagram shown in figure 1(c)). Absence of a single-phase austenite region at high temperature results in the δ-ferrite stringer band parallel to the primary rolling direction [28]. By optimum annealing treatment of wrought alloys around 800 °C, duplex lightweight Fe–Mn–Al(Si)–C alloys having a bimodal structure consisting of clustered austenite particles with a coarse ferrite stringer matrix can be obtained. Seo et al [30] investigated the deformation behavior of Fe–3.5Mn–5.9Al–0.4C alloy and found that most of the deformation was accommodated by the ferrite, while the clustered austenite particles undergo a strain-induced martensitic transformation. However, some of the austenite particles do not show martensitic transformation when they have unfavorable orientations against deformation to the loading direction. The strain-induced martensitic transformation of austenite particles resulted in a good combination of tensile properties (tensile strength over 800 MPa and total elongation over 40%). Ryu et al [55] examined the deformation behavior of Fe–5.8Mn–3.1Al–0.47Si–0.12C alloy. They also reported the preferential straining in the coarse ferrite matrix during tensile deformation. It was demonstrated that the partitioning of strain to a coarse ferrite matrix might mislead the austenite stability analysis if it were evaluated based on the apparent strain applied to the specimen. That is to say, the mechanical stability of austenite particles surrounded by a coarse ferrite matrix could be overestimated if the preferential strain accommodation in ferrite was not properly considered.
6. Conclusion
The lightweight Fe–Al–Mn–C alloys comprise a highly property-flexible alloy system. Typical compositions are in the range of 3–30% Mn, 3–12% Al and 0.1–1.5% C with the balance Fe. Solution-treated alloys have a single-phase austenitic matrix or duplex matrix consisting of ferrite and austenite depending on the relative contents of C, Mn and Al. With a dispersion of nano-sized κ carbides in the austenite matrix, these alloys exhibit superior strength.
-
•
The mechanical properties are greatly influenced by stacking fault energy as far as fully austenitic alloys with high Mn (>15%Mn) and low Al (<3–6%Al) contents are concerned. However, when the Al content is higher, mechanical properties are also controlled by κ-carbide precipitation.
-
•
Even during water quenching from solution treatment, κ-carbides can precipitate provided that the chemical driving force is sufficiently high due to larger C and Al contents.
-
•
Effects of alloying elements on the density of austenitic Fe–Al–Mn–C alloys are critically analyzed based on the literature. In terms of density reduction per 1 wt% addition, the effectiveness of C is about four times higher than that of Al.
-
•
Fe–Al–Mn–C austenitic alloys containing κ-carbides deform in planar glide mode attributed to the slip plane softening originating from shearing of κ-carbide by dislocation.
Although many studies on Fe–Al–Mn–C lightweight alloys have been published until now, there are still many stimulating and inspiring challenges which need to be faced to vitalize this field of interest. The activities emphasized will be:
-
•
the control of κ-carbide precipitation during continuous cooling from a variety of thermal histories:
Most of the mechanical properties reviewed in this paper were collected from the solution-treated conditions. In order to avoid the uncontrollable precipitation of κ-carbides, most of the Fe–Al–Mn–C alloys have been water quenched from solution treatment temperatures above 1000 °C. For the design of lightweight steels that can be compatible with industrial conditions, it is critical to have a measure to control the κ-carbide precipitation;
-
•
deeper analysis of the dislocation–particle interactions:
the fundamental reason why Fe–Al–Mn–C lightweight alloys strain-harden by planar glide is still unknown. Recent investigations revealed the shearing of κ-carbides by the dislocation responsible for planar glide. Nevertheless, the effects of the precipitate size and composition on the interaction with dislocation are not known. Further progress is expected from the dislocation dynamics combined with in situ TEM observation and ab initio calculations;
-
•
measure to utilize DO3-Fe3Al and/or B2-FeAl intermetallics as the second phases in the alloy matrix:
At present, the maximum Al content in Fe–Al–Mn–C alloys is around 12%. A further increase of Al content will be interesting for obtaining a higher density reduction as long as uncontrollable formation of κ-carbide can be avoided. One of the possible ways to increase the Al content is by utilizing Fe–Al intermetallics as the second phase; this may shed more light on this emerging field.
References
- Bhadeshia H K D H. Proc. R. Soc. Lond. A. 2010;466:3–18. doi: 10.1098/rspa.2009.0407. [DOI] [Google Scholar]
- Fan D W, Kim H S. and De Cooman B C. Steel Res. Int. 2009;80:241–8. [Google Scholar]
- Jang J H, Lee C H, Heo Y U. and Suh D W. Acta Mater. 2012;60:208–17. doi: 10.1016/j.actamat.2011.09.051. [DOI] [Google Scholar]
- Grässel O, Krüger L, Frommeyer G. and Meyer L W. Int. J. Plast. 2000;16:1391–409. doi: 10.1016/S0749-6419(00)00015-2. [DOI] [Google Scholar]
- Lee P Y, Chiu C S, Gau Y J. and Wu J K. High Temp. Mater. Proc. 1992;10:141–4. [Google Scholar]
- Shih S T, Tai C Y. and Perng T P. Corrosion. 1993;49:130–4. doi: 10.5006/1.3299207. [DOI] [Google Scholar]
- Saxena V K, Krishna M S G, Chhaunker P S. and Radhakrishnan V M. Int. J. Press. Vessels Pip. 1994;60:151–7. doi: 10.1016/0308-0161(94)90021-3. [DOI] [Google Scholar]
- Zhu X M. and Zhang Y S. Corrosion. 1998;54:3–12. doi: 10.5006/1.3284826. [DOI] [Google Scholar]
- Herrmann J, Inden G. and Sauthoff G. Acta Mater. 2003;51:2847–57. doi: 10.1016/S1359-6454(03)00089-2. [DOI] [Google Scholar]
- Hamada A S. and Karjalainen L P. Can. Metall. Q. 2006;45:41–8. doi: 10.1179/000844306794409020. [DOI] [Google Scholar]
- Morris D G, Muñoz-Morris M A. and Requejo L M. Acta Mater. 2006;54:2335–41. doi: 10.1016/j.actamat.2006.01.008. [DOI] [Google Scholar]
- James P. J. Iron Steel Inst. 1969;207:54–7. [Google Scholar]
- Lai H J. and Wan C M. J. Mater. Sci. 1989;24:2449–53. doi: 10.1007/BF01174510. [DOI] [Google Scholar]
- Chen F C, Li P, Chu S L. and Chou C P. Scr. Metall. Mater. 1991;25:585–90. doi: 10.1016/0956-716X(91)90096-J. [DOI] [Google Scholar]
- Kim Y G, Han J M. and Lee J S. Mater. Sci. Eng. A. 1989;114:51–9. doi: 10.1016/0921-5093(89)90844-7. [DOI] [Google Scholar]
- Frommeyer G. and Brüx U. Steel Res. Int. 2006;77:627–33. [Google Scholar]
- Sutou Y, Kamiya N, Umino R, Ohnuma L. and Ishida K. ISIJ Int. 2010;50:893–9. doi: 10.2355/isijinternational.50.893. [DOI] [Google Scholar]
- Koster W. and Tonn W. Arch Eisenhüttenwes. 1933;7:365–6. [Google Scholar]
- Schmatz D J. Trans. AIME. 1959;215:121–3. [Google Scholar]
- Krivonogov G S, Alekseyenko M F. and Solov'yeva G G. Phys. Metals Metall. 1975;39:86–92. [Google Scholar]
- Ishida K, Ohtani H, Satoh N, Kainuma R. and Nishizawa T. ISIJ Int. 1990;30:680–6. doi: 10.2355/isijinternational.30.680. [DOI] [Google Scholar]
- Acselrad O, Kalashnikov I S, Silva E M, Simao R A, Achete C A. and Pereira L C. Metall. Mater. Trans. A. 2002;33:3569–72. doi: 10.1007/s11661-002-0345-5. [DOI] [Google Scholar]
- Chin K G, Lee H J, Kwak J H, Kang J Y. and Lee B J. J. Alloys Compounds. 2010;505:217–23. doi: 10.1016/j.jallcom.2010.06.032. [DOI] [Google Scholar]
- Lee H J, Sohn S S, Lee S, Kwak J H. and Lee B J. Scr. Mater. 2012 ( http://dx.doi.org/10.1016/j.scriptamat.2012.10.032) [Google Scholar]
- Frommeyer G, Drewes E J. and Engl B. Rev. Metall. Cah. Inf. Tech. 2000;97:1245–53. [Google Scholar]
- Falat L, Schneider A, Sauthoff G. and Frommeyer G. Intermetallics. 2005;13:1256–62. doi: 10.1016/j.intermet.2004.05.010. [DOI] [Google Scholar]
- Rana R, Liu C. and Ray R K. Scr. Mater. 2012 ( http://dx.doi.org/10.1016/j.scriptamat.2012.10.004) [Google Scholar]
- Suh D W, Park S J, Lee T H, Oh C S. and Kim S J. Metall. Mater. Trans. A. 2010;41:397–408. doi: 10.1007/s11661-009-0124-7. [DOI] [Google Scholar]
- Hwang S W, Ji J H, Lee E G. and Park K T. Mater. Sci. Eng. A. 2011;528:5196–203. doi: 10.1016/j.msea.2011.03.045. [DOI] [Google Scholar]
- Seo C H, Kwon K H, Choi K, Kim K H, Kwak J H, Lee S. and Kim N J. Scr. Mater. 2012;66:519–22. doi: 10.1016/j.scriptamat.2011.12.026. [DOI] [Google Scholar]
- Park S J, Hwang B, Lee K H, Lee T H, Suh D W. and Han H N. Scr. Mater. 2012 ( http://dx.doi.org/10.1016/j.scriptamat.2012.09.030) [Google Scholar]
- Choi K, Seo C H, Lee H, Kim S K, Kwak J H, Chin K G, Park K T. and Kim N J. Scr. Mater. 2010;63:1028–31. doi: 10.1016/j.scriptamat.2010.07.036. [DOI] [Google Scholar]
- Park K T, Jin K G, Han S H, Hwang S W, Choi K. and Lee C S. Mater. Sci. Eng. A. 2010;527:3651–61. doi: 10.1016/j.msea.2010.02.058. [DOI] [Google Scholar]
- Frommeyer G, Brüx U. and Neumann P. ISIJ Int. 2003;43:438–46. doi: 10.2355/isijinternational.43.438. [DOI] [Google Scholar]
- Heo Y U, Song Y Y, Park S J, Bhadeshia H K D H. and Suh D W. Metall. Mater. Trans. A. 2012;43:1731–5. doi: 10.1007/s11661-012-1149-x. [DOI] [Google Scholar]
- Kubaschewski O. Iron—Binary Phase Diagrams. New York: Springer; 1982. [Google Scholar]
- Storchak N A. and Drachinskaya A G. Phys. Met Metall. 1977;44:123–30. [Google Scholar]
- Sato K, Tagawa K. and Inoue Y. Scr. Metall. 1988;22:899–902. doi: 10.1016/S0036-9748(88)80071-1. [DOI] [Google Scholar]
- Han K H. and Choo W K. Metall. Trans. A. 1989;20:205–14. [Google Scholar]
- Sato K, Tagawa K. and Inoue Y. Metall. Trans. A. 1990;21:5–11. [Google Scholar]
- Kalashnikov I, Acselrad O, Shalkevich A. and Pereira L C. J. Mater. Eng. Perform. 2000;9:597–602. doi: 10.1361/105994900770345430. [DOI] [Google Scholar]
- Bentley A P. J. Mater. Sci. Lett. 1986;5:907–8. doi: 10.1007/BF01729270. [DOI] [Google Scholar]
- Lin C L, Chao C G, Bor H Y. and Liu T F. Mater. Trans. 2010;51:1084–8. doi: 10.2320/matertrans.M2010013. [DOI] [Google Scholar]
- Kimura Y, Hayashi K, Handa K. and Mishima Y. Mater. Sci. Eng. A. 2002;329–331:680–5. [Google Scholar]
- Howell R A. and Van Aken D C. Iron Steel Technol. 2009;6:193–212. [Google Scholar]
- Yoo J D. and Park K T. Mater. Sci. Eng. A. 2008;496:417–24. doi: 10.1016/j.msea.2008.05.042. [DOI] [Google Scholar]
- Park K T. Scr. Mater. 2012 ( http://dx.doi.org/10.1016/j.scriptamat.2012.10.004) [Google Scholar]
- Chang S C, Hsiau Y H. and Jahn M T. J. Mater. Sci. 1989;24:1117–20. doi: 10.1007/BF01148807. [DOI] [Google Scholar]
- Charles J, Berghezan A. and Lutts A. J. Physique Coll. C1. 1984;45:619–23. [Google Scholar]
- Olson G B. and Cohen M. Metall. Trans. A. 1976;7:1897–904. [Google Scholar]
- Olson G B. and Cohen M. Metall. Trans. A. 1976;7:1905–14. [Google Scholar]
- Lai H J. and Wan C M. Scr. Metall. 1989;23:179–82. doi: 10.1016/0036-9748(89)90406-7. [DOI] [Google Scholar]
- Remy L. and Pineau A. Mater. Sci. Eng. 1977;28:99–107. doi: 10.1016/0025-5416(77)90093-3. [DOI] [Google Scholar]
- Kuhlmann-Wilsdorf D. Mater. Sci. Eng. A. 2001;315:211–6. doi: 10.1016/S0921-5093(01)01204-7. [DOI] [Google Scholar]
- Ryu J H, Kim D I, Kim H S, Bhadeshia H K D H. and Suh D W. Scr. Mater. 2010;63:297–9. doi: 10.1016/j.scriptamat.2010.04.020. [DOI] [Google Scholar]


