
Figure 10.
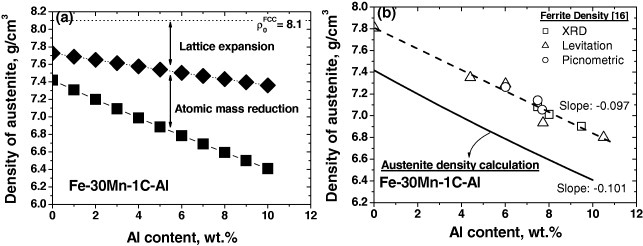
Density as a function of the aluminum content. (a) Austenitic density of Fe–30Mn–1C–Al alloys calculated by equation (2) with different aluminum contents (0–10%). The lower linear curve represents the overall decrease in density. The upper one shows the density reduction due to the lattice dilatation of austenite. (b) The calculated density of Fe–30Mn–1C–Al austenitic alloys is compared with the density of Fe–Al ferritic alloys [16].