Abstract
Innate immune response is believed to be among the earliest provisional cellular responses, and mediates the interactions between microbes and cells. Toll-like receptors (TLRs) are critical to these interactions. We hypothesize that TLRs also play an important role in interactions between nanoparticles (NPs) and cells, although little information has been reported concerning such an interaction. In this study, we investigated the role of TLR3, TLR4 and TLR7 in cellular uptake of titanium dioxide NP (TiO2 NP) agglomerates and the resulting inflammatory responses to these NPs. Our data indicate that TLR4 is involved in the uptake of TiO2 NPs and promotes the associated inflammatory responses. The data also suggest that TLR3, which has a subcellular location distinct from that of TLR4, inhibits the denaturation of cellular protein caused by TiO2 NPs. In contrast, the unique cellular localization of TLR7 has middle-ground functional roles in cellular response after TiO2 NP exposure. These findings are important for understanding the molecular interaction mechanisms between NPs and cells.
Keywords: 10.1
Keywords: first-host defense system, inflammatory response, live cell-based sensor cells, protein denaturation induction, titanium dioxide nanoparticles, toll-like receptor
1. Introduction
Nanoparticles (NPs) have diverse applications not only in primary research but also in industry [1, 2]. For example, titanium dioxide nanoparticles (nano-TiO2) have been used commercially in pigments, in cosmetic products and as pharmaceutical carriers. The increasing use of NPs has led to an increase in potential NP exposure in humans and the environment [3]. One major nanotoxicological concern is that NPs are easily taken up by cells and can induce immune activation. For example, in vivo studies have shown that inhaled nano-TiO2 leads to inflammatory response [4], changes in fibroblast cell adhesion and proliferation [5] and genetic damage [6]. Given the recent origin of engineered NPs, cells are not expected to have any pre-existing NP-specific response/defense system. By analogy to other classes of particles, we presume that NPs induce innate immune responses and other innate cellular stress responses, which we designate as the ‘first host defense system’ (FHDS). This response would be very important for understanding the interaction mechanism between the NPs and cells.
Toll-like receptors (TLRs) are expected to be key to such an FHDS, e.g. the innate immune response [7–11]. As is well known, TLRs play a frontline protective role in cellular defense. TLRs are transmembrane proteins that include both an extra-cellular domain (responsible for ligand recognition) and a cytoplasmic domain (required for initiating signaling) [7]. As suggested by their range of ligands and the subcellular locations, TLRs recognize a wide range of ‘foreign’ materials [8, 9]. For example, TLRs that localize to the cell surface (TLR2 and TLR4) primarily recognize bacterial components. In contrast TLRs that localize to the endocytic compartments (TLR3 and TLR7) mainly recognize viruses. But TLR7 is slightly different; it could be found at the plasma membrane and the membrane of the endosome [10]. The TLR7 at the plasma membrane, called ‘non-functional TRL7’ (n-TLR7), can only deliver potential ligands but cannot induce signal transduction such as nuclear factor κB (NF-κB) activation. In contrast, the TLR7 at the endosome membrane is called ‘functional TLR7’ (f-TLR7) because, with the help of enzymes in the endosome, functionally competent TLR7 can deliver potential ligands and also induce signaling. However, for some other TLRs, their ligands or subcellular locations are not as well defined. For instance, the function of TLR10, a human-specific TLR, remains poorly characterized [11].
Live cell-based sensor reporter systems were employed to detect the FHDS stimulated by NPs because of their highly sensitive, simple and effective properties compared with other traditional methods [12]. In our previous work, two kinds of live cell-based sensor reporter systems, the NF-κB reporter system [13] and the heat shock protein (HSP) reporter system [14], were established, which are sensitive to changes in relative gene expression in response to toxic substances or other external stimuli.
In this work, TLR3-, TLR4- and TLR7-associated TiO2 NP cellular uptake was studied. Besides, the role of three TLRs in cellular response, cellular inflammatory and stress response, after TiO2 NP exposure, was also investigated. This work would be important for the NP cellular uptake and the molecular nanotoxicological response.
2. Materials and methods
2.1. Cells and culture
In this study, HepG2, a human hepatocellular carcinoma cell line, and K562, a human chronic myelogenous leukemia cell line, were used. HepG2 was cultured in Dulbecco's modified Eagle's medium (Nacalai Tesque, Kyoto, Japan) supplemented with 10% fetal bovine serum (FBS; Biowest, UK), 100 U ml−1 penicillin and 100 μg ml−1 streptomycin (Nacalai Tesque, Kyoto, Japan). K562 was cultured in RPMI-1640 (Invitrogen, Grand Island, NY, USA) with 10% FBS (Tissue Culture Biologicals), 100 U ml−1 penicillin and 100 μg ml−1 streptomycin. Both cell lines were incubated at 37 °C in a humidified atmosphere with 5% CO2.
2.2. Plasmids employed
pGL3-Control vector (pGL3 plasmid; Promega, Madison, WI, USA) was employed as an ‘empty’ control reporter plasmid. The NF-κB reporter plasmid, GL4.32[luc2P/NF-κB-RE/Hygro] vector, was obtained from Promega (Madison, WI, USA). The HSP70B′ promoter–reporter plasmid, designated HSP reporter plasmid, includes the promoter region (from −287 to +112 bp) of the HSP70 gene. All the reporter plasmids contain SV40 promoters and enhancer sequences, resulting in strong expression of the luciferase-encoding gene (luc+) in many types of mammalian cells. However, compared with the pGL3 blank control, the NF-κB reporter and HSP reporter plasmid exhibit NF-κB- or HSP-dependent luc+ expression (respectively) upon stimulation. The pRL-CMV vector (CMV, Renilla luciferase-encoding control plasmid; Promega) contains the CMV promoter upstream of the Renilla luciferase gene and was used as an internal control for variations in transfection efficiency.
TLR-encoding genes were purchased from InvivoGen (San Diego, CA, USA). The pUNO1-mcs expression vector was used as an ‘empty’ control vector. Since pUNO1-mcs does not contain a therapeutic gene, it can be used in conjunction with other vectors of the pUNO1 family to serve as an experimental control. Overproduction of TLR3, TLR4 and TLR7 was provided by transfection with pUNO-hTLR3 (which encodes the human TLR3 protein), pUNO1-hTLR04a (CD284a) (which harbors the human TLR04a (CD284a)—encoding open reading frame) and TLR7 (pUNO1-hTLR7, a plasmid expressing the human TLR7 gene), respectively.
2.3. Gene expression analysis: PCR array
For polymerase chain reaction (PCR) array analysis, K562 (at 6 × 10⁵ cells ml−1) was seeded in a culture dish containing culture medium with or without TiO2 NPs (suspended at 10 μg ml−1). After 24 h of exposure to the TiO2 NPs, the cells were detached by mechanical dissociation, and the expressions of 89 genes that are indicative of human TLR signaling pathways were examined using the RT2 profiler PCR array (SA Bioscience; Qiagen, Maryland, USA) as follows. Total cellular RNA was extracted from TiO2 NP-exposed cells using an RNeasy kit (Qiagen, Maryland, USA) according to the manufacturer's instructions. An aliquot (4 μg) of extracted total RNA was reverse transcribed into cDNA with random hexamer primers using the PrimeScript II first strand cDNA synthesis system (Takara, Japan) according to the manufacturer's protocol. PCR array analysis was performed using an ABI PRISM 7000 sequence detection system (Applied Biosystems, Singapore). Standard reactions were prepared in individual wells of 96-well RT2 profiler PCR array plates containing forward and reverse primers for several genes indicative of human TLR signaling pathways. The cDNA was diluted fivefold with distilled water and mixed with a 2 × PCR master mix according to the manufacturer's protocol. An aliquot of the reaction mixture (25 μl) containing the test cDNA was then added to each well. The thermocycling conditions were 95 °C for 10 s followed by 40 cycles of 95 °C for 15 s and 60 °C for 1 min. As the control, cDNA was prepared from cells that lacked exposure to NPs.
2.4. RT-PCR
Total RNA and cDNA were synthesized as described. The PCR primers for TLRs were purchased from InvivoGen (San Diego, CA, USA) and GAPDH (GGAGTCCCTGCCACA and GGCCCCTCCCCTCTTCA) were used as the control. PCR products were analyzed on 2% (w/v) agarose gels and then visualized under UV light.
2.5. Construction of the NF-κB reporter system
The reporter plasmid (blank control reporter, pGL3 plasmid or NF-κB reporter plasmid), CMV and TLR expression vector (or empty control) were co-transfected into HepG2 cells to generate the NF-κB reporter system. The target HepG2 cells were seeded on 48-well plates, incubated overnight and co-transfected with the plasmids using LipofectamineTM LTX reagent (Invitrogen, Carlsbad, CA, USA) according to the supplier's protocol. The medium was renewed at 4–6 h post-transfection.
2.6. Construction of the HSP reporter system
An HSP reporter system was generated by transfection as above, but using the HSP reporter plasmid in place of the NF-κB reporter plasmid.
2.7. TiO2 NP preparation and exposure
The preparation and characterization were described in a previous study [13, 14]. Briefly, nano-TiO2 (Aeroxide® P25; Sigma-Aldrich, Saint Louis, MO, USA) was dispersed in distilled water and autoclaved at 120 °C for 20 min. The suspension was cooled to room temperature and then sonicated for 10 min at 200 kHz by a high-frequency ultrasonic sonicator (MidSonic 600, Kaijo, Japan). The resulting nano-TiO2 suspension was designated ‘TiO2 NPs’. The concentration of TiO2 NPs was determined using a UV–Vis spectrophotometer (UV-1600, Shimadzu, Japan). The suspension was adjusted to the desired concentration by the addition of distilled water and then stored at 4 °C until use. The particle size distribution was measured by dynamic light scattering (Zetasizer Nano-ZS, Malvern Instruments, Malvern, UK). The particle sizes of TiO2 NPs were determined to be 216 ± 70 nm; the sizes of the aggregated TiO2 NPs are stable for several weeks under the indicated storage conditions.
For the relevant cell cultures, the TiO2 NPs were diluted into supplemented medium and used as described above.
For the reporter gene (transfected cell) assays, the culture medium was replaced (1 day after transfection) with a medium containing the TiO2 NPs at the intended concentration. Specifically, TiO2 NPs were added into the culture medium immediately before the medium was applied to the cells. After the indicated exposure times, the cells were harvested and assayed for luciferase activity.
2.8. Luciferase activity assessment
The luciferase activities were assessed by the Dual-Luciferase Reporter Assay System (Promega, Madison, WI, USA), as described previously [13, 14]. Following TiO2 NP exposure, the cells were lysed in 1 × passive lysis buffer , and luciferase and Renilla light units were measured using a Lumat LB9507 (Berthold Technologies, Germany) luminometer according to the manufacturer's protocol for the Dual Luciferase assay.
All the results represent at least three independent tests. Data are expressed as means ± standard deviations (s.d.).
2.9. Confocal microscopy observation
Confocal laser scanning microscopy was performed using a Zeiss LSM510 microscope (Carl Zeiss, Oberkochen, Germany). For this experiment, HepG2 cells were cultured on coverslips (13 mm diameter; Matsunami Glass Ind., Ltd, Osaka, Japan). On the following day, cultures were transfected (using the Lipofectamine™ LTX Reagent, as described above) with the expression vectors encoding TLR3 or TLR4. At 24 h after transfection, culture medium was replaced with a medium containing TiO2 NPs at 10 μg ml−1. Untransfected cells and cells without NP exposure were used as controls. After a 3 h incubation, the cells were washed with PBS and fixed with 4% paraformaldehyde for 5 min. Fixed cells were then stained for lysosomes and nuclei with 50 nM Lysotracker Red DND-99 (Invitrogen), and 1 μg ml−1 Hoechst33342 (Dojin Chemical), respectively, with staining performed for 30 min in a 5% CO2 environment. Figures were created using NIH ImageJ software.
3. Results and discussion
3.1. TLRs participate in the cellular response to TiO2 NPs exposure
For commercial products, NPs form aggregates and no NPs less than 100 nm in diameter can be found [15]. For this practical reason, TiO2 NPs with about 25 nm mean diameter were used as the raw particles to prepare the TiO2 NPs suspension in a cell culture medium in this study, and the average diameter of NP agglomerates is about 200 nm. In addition, in this work, 10 μg ml−1 was used as the concentration for TiO2 NP exposure, as described in our previous work [16].
Gene induction following exposure to TiO2 NPs was assessed using a PCR array that covers genes encoding components of human TLR signaling pathways. The array revealed that TiO2 NP exposure induced several genes, including those encoding CD180, TLR7, CD86, CSF3, IFNA1, IFNG, IL10, IL12A, IL2, LTA, LY96, TLR10, TLR2, TLR3, TLR4 and TNF (table 1). This result shows that receptors of the TLR family could participate in the cellular response to TiO2 NP exposure.
Table 1.
Genes exhibiting induction of mRNA expression in K562 cells after a 24 h 10 μg ml−1 TiO2 NP exposure in the PCR array. (The genes investigated in this work are shown in boldface.)
| Symbols of genes | Description of the genes | Fold regulationa |
|---|---|---|
| CD180 | CD180 molecule | −2.24 |
| TLR7 | Toll-like receptor 7 | 10.96 |
| CD86 | CD86 molecule | −1.79 |
| CSF3 | Colony stimulating factor 3 (granulocyte) | 1.69 |
| IFNA1 | Interferon, alpha 1 | −2.36 |
| IFNG | Interferon, gamma | 1.60 |
| IL10 | Interleukin 10 | 4.33 |
| IL12A | Interleukin 12A (natural killer cell stimulatory factor 1, cytotoxic lymphocyte maturation factor 1, p35) | 1.44 |
| IL2 | Interleukin 2 | 1.45 |
| LTA | Lymphotoxin alpha (TNF superfamily, member 1) | 2.72 |
| LY96 | Lymphocyte antigen 96 | −1.53 |
| TLR10 | Toll-like receptor 10 | 1.00 |
| TLR2 | Toll-like receptor 2 | 2.03 |
| TLR3 | Toll-like receptor 3 | 7.33 |
| TLR4 | Toll-like receptor 4 | −1.15 |
| TNF | Tumor necrosis factor | 6.94 |
Fold regulation represents fold change results in a biologically meaningful way. Fold change values greater than 1 indicate a positive regulation or an up-regulation, and the fold regulation is equal to the fold change. Fold change values less than 1 indicate a negative regulation or down-regulation, and the fold regulation is the negative inverse of the fold change.
After knowing the potential receptors for TiO2 NPs, endogenous expressions of TLR2, 3, 4 and 7 in HepG2 and K562 cell lines were checked by the RT-PCR method (figure 1). The HepG2 cell line was chosen for further study, because when compared with the K562 cell line, HepG2 cells show much lower endogenous expression of TLR3, 4 and 7 (figure 1). Therefore, in the present study, we focused on potential contributions of TLR3, TLR4 and TLR7. These receptors have distinct subcellular locations, and so are expected to represent different aspects of cellular uptake and response to TiO2 NP exposure.
Figure 1.
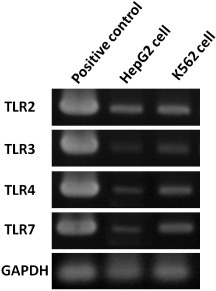
Expressions of TLRs in HepG2 and K562 cells. Electrophoresis was employed to analyze the products after RT-PCR amplification with TLR2, TLR3, TLR4, TLR7 and GAPDH (a housekeeping gene, control gene) in HepG2 (line 2) and K562 (line 3) cells. RNAs were extracted from the original HepG2 and K562 cells without NPs exposure. The positive control (TRLs cDNA) is shown in each panel (line 1).
3.2. TLRs enhances NF-κB response to TiO2 NPs
Recently, it was reported that nanomaterials, especially NPs, could induce cellular inflammation [16–18]. For this reason, NF-κB is widely studied as it is known to be a key transcription factor involved in transduction of signals that promote inflammation and cell death. In a previous work, an NF-κB reporter system (consisting of an NF-κB promoter-driven luciferase gene plasmid) was prepared for NF-κB response detection induced by TiO2 NPs [13]. In the present study, this NF-κB reporter system was used to study the effect of TLR3, TLR4 or f-TLR7 on cellular response to NP exposure. The results, shown in figure 2, demonstrated that the NF-κB response was increased upon the induction of TLR gene expression (by transfection with TLR-encoding genes). This observation indicated that three TLRs were positive mediators of the cellular response to NP exposure. A comparison also revealed that the NF-κB response was more rapid in cells transfected with TLR4 than in cells transfected with TLR3 and f-TLR7. This difference could reflect the distinct locations of the TLRs. TLR4, which mainly localizes to the plasma membrane, can initiate the NF-κB response from the cell surface. In contrast, TLR3 and f-TLR7 localize to the endosomes; activation of the NF-κB response by TLR3 would have to wait until NPs had been taken up into the cells. In such a model, all three TLRs could participate in the cellular response to TiO2 NP exposure. Moreover, considering the correlation between the NF-κB response and the inflammation induced by TiO2 NP exposure, such a model would predict that three TLRs could also participate in the cellular inflammatory response.
Figure 2.
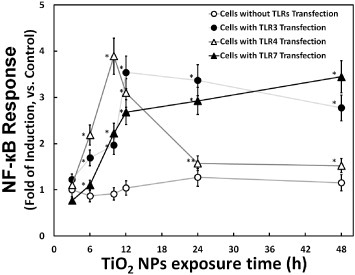
Time course of TiO2 NP-induced cellular NF-κB response in the presence or absence of TLR overproduction. The cellular NF-κB response (fold induction, compared with the control) at the indicated times is plotted after exposure to 10 μg m1−1 TiO2 NPs. The NF-κB reporter system was prepared by transfection of HepG2 cells with an NF-κB reporter plasmid without (mock transfection; hollow circle) or with TLR-encoding expression vector (TLR3: solid circle; TLR4: hollow triangle; and TLR7: solid triangle). Data represent means ± s.d. for at least three replicates. Data were statistically analyzed with the Student's t-test (∗p < 0.05, ∗∗p < 0.5, compared with the cells without TLRs transfection).
3.3. TLR4 and TLR7 enhance HSP70B′ response to TiO2 NPs, whereas TLR3 reduced it
A previous work used an HSP reporter system (consisting of an HSP70B′ promoter-driven luciferase gene plasmid) to demonstrate that the cellular heat shock response was sensitive to protein denaturation induced by TiO2 NPs [14]. In the present study, this HSP reporter system was used to monitor the cellular protein denaturation risk induced by NP uptake in the cytoplasm. The results, shown in figure 3, revealed an increase (compared to control transfectants) in HSP70B′ response upon transfection with the TLR4- or TLR7-encoding gene. In contrast, this HSP70B′ response was reduced in cells transfected with the TLR3-encoding gene. Protein denaturation is a known inducer of the HSP70B′ response, suggesting that the TLR effects could reflect changes in protein denaturation. We hypothesize that elevated TLR4 or f-TLR7 levels increase the uptake of unconfined NP in the cytoplasm, where the NPs cause protein denaturation. On the other hand, elevated levels of TLR3 or n-TLR7 could combine with unengaged NPs in the cytoplasm and retain those NPs in the endosome, thereby reducing protein denaturation by TiO2 NPs. This hypothesis is consistent with the slower kinetics of the protein denaturation induction (HSP70B′ response, figure 3) compared to inflammation induction (NF-κB response, figure 2). Indeed, the HSP70B′ response is expected to be slower, because induction requires NP uptake by cells before protein denaturation begins. Hence, although three TLRs enhance inflammatory response, the distinct subcellular locations of TLR3 and TLR4 could result in opposing effects on NP-mediated protein denaturation. Moreover, considering the specific characteristic of TLR7, it would not be difficult to understand its middle-ground behavior.
Figure 3.
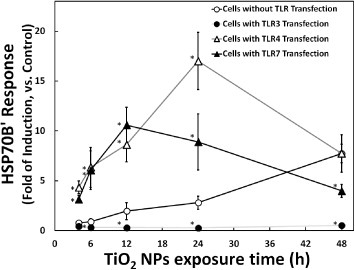
Time course of TiO2 NP-induced HSP70B′ response in the presence or absence of TLR overproduction. HSP70B′ response (fold induction, compared with the control) at the indicated times is plotted after exposure to 10 μg m1−1 TiO2 NPs. The HSP70B′ reporter system was prepared by transfection of HepG2 cells with an HSP70B′ reporter plasmid without (mock transfection; hollow circle) or with TLR-encoding expression vector (TLR3: solid circle; TLR4: hollow triangle; and TLR7: solid triangle). Data represent means ± s.d. for at least three replicates. Data were statistically analyzed with the Student's t-test (∗p < 0.05, compared with the cells without TLRs transfection).
The gene silencing technique, such as small interference RNA (siRNA) against TLRs in TLR-positive cells, would be a good method for understanding the roles of TLRs in NPs. However, for technical reasons, only the TLR gene overexpression method was used in this paper. It is difficult to knock down TLR genes using siRNA technology. For example, to knock down the TLR expressions in testing cells, both mRNA and protein levels could be decreased only 75 and 50%, respectively [19], which means that there are still 50% TLRs expressed.
3.4. The localization of TiO2 NPs in TLR-transfected HepG2 cells
Confocal microscopy (figure 4) was used to verify the location of TiO2 NPs in cells. The images revealed that TiO2 NPs were internalized within cells, although not apparently within nuclei. Fewer TiO2 NPs were found in cells that had not been transfected with a TLR-encoding gene (figure 4(a)) compared to those transfected with the gene for TLRs (figures 4(b)–(d)). In cells transfected with the gene for TLR3 (figure 4(b)), NPs accumulated primarily in endosomes (light yellow regions), in contrast to the irregular NP distribution observed with TLR4 transfection (figure 4(c)). Besides, the NPs are irregularly distributed in the cytoplasm of cells transfected with the gene for TLR7 (figure 4(d)), both in the endosome (yellow area) and outside of it. All of them show obvious NP uptake compared with the cell without NP exposure (figure 4(e)). These images demonstrate that overproduction of TLRs increases cellular uptake of NPs, although the distinct patterns seen may reflect the distinct locations and functions of the TLR proteins. For K562 cells, because expression levels of TLRs in K562 were relatively high, the TiO2 NPs cellular localization in K562 was similar to figures 4(b)–(d) (data not shown).
Figure 4.
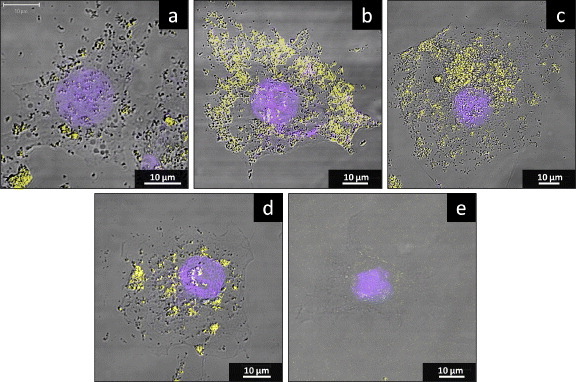
The localization of TiO2 NPs in HepG2 cells in the presence or absence of TLR overproduction. HepG2 cells were mock transfected or transfected with the TLR-encoding expression vector. At 24 h after transfection, the cell culture medium was replaced with a medium containing 10 μg ml−1 TiO2 NPs and incubated for a further 24 h before staining for lysosomes (yellow) and nuclei (blue). Panels correspond to cells after (a) mock transfection or transfection with TLR3 (b) TLR4 (c) TLR7 (d) and encoding expression vector. Moreover, the cell without TiO2 NP exposure is also shown (e).
3.5. The hypothesis that TLR3, 4 and 7 promote a cellular FHDS response to TiO2 NPs
Our data suggest the hypothesis presented schematically in figure 5. NPs would traverse the cell membrane by transportation via transmembrane receptors (e.g. TLR4 or n-TLR7) at the plasma membrane (or by other mechanisms). Binding of NPs to TLR4 at the cell membrane would result in the activation of NF-κB and induction of the NF-κB response (including the expression of genes encoding inflammatory cytokines). Unconfined NPs in the cytoplasm would result in the denaturation of cytoplasmic proteins and subsequent induction of the HSP70B′ response. Meanwhile, TLR3 or f-TLR7 (located on the endosomal membrane) would also induce NF-κB activation, albeit at a delay compared to the TLR4-mediated process. At the same time, binding by TLR3 or f-TLR7 would segregate NPs into the endosomes, reducing the levels of free cytoplasmic NPs and attenuating protein denaturation and the HSP70B′ response.
Figure 5.
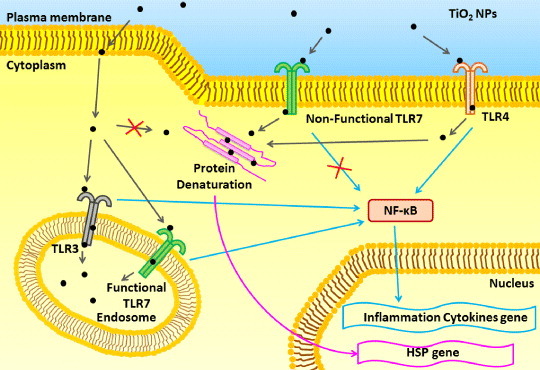
Model for the role of TLR3, TLR4 and TLR7 after TiO2 NP exposure. See the text for explanation.
Moreover, as shown in table 1, other TLRs (besides TLR3, TLR4 and TLR7 investigated here) are induced after NP exposure, including TLR2 and TLR10. Unlike TLR3, TLR4 and TLR7 (which function as homodimers), TLR2 functions as a heterodimer, requiring interaction with TLR1 or TLR6 to induce NF-κB activation [9]. As mentioned above, the localization and function of TLR10 remain unclear. Thus, for TLR2 and TLR10, the effects on the response to NP exposure should also be studied in future. Beyond NP, recently Chen et al [20] have reported their work on TLR4- and TLR9-related graphene oxide nanosheet cellular autophagy and the induced inflammatory response. From their work, it can be seen that the FHDS model would be suitable for different kinds of nanomaterials, such as NPs and nanosheets. Moreover, TLRs would be important for different nanomaterial uptake and their cellular response, not only NPs but also nanosheets. Furthermore, for the interaction between TLRs and TiO2 NPs, we suppose that there might be two possibilities: (i) just like stimuli such as lipopolysaccharide, some small molecules such as the lipopolysaccharide binding protein and CD14 could be absorbed on the surface of TiO2 NPs, and then the complex incorporated with TLRs; (ii) considering the ‘large’ size of the TiO2 NPs we used, we suppose that TiO2 NPs could directly associate with TLRs. This assumption may be more complicated and is the subject of ongoing work.
4. Conclusions
Our data show that TLRs could play an important role in NP uptake while also promoting different cellular responses to NP exposure. This work provides, from a molecular nanotoxicology point of view, insights into the role of TLR3, TLR4 and TLR7 in the uptake and cellular response to NP exposure. These receptors are expected to contribute to the molecular interactions between nanomaterials and cells.
References
- Brower V. J. Natl Cancer Inst. 2006;98:9. doi: 10.1093/jnci/djj028. [DOI] [PubMed] [Google Scholar]
- Olson M S. and Gurian P L. J. Nanoparticle Res. 2012;14:786. doi: 10.1007/s11051-012-0786-8. [DOI] [Google Scholar]
- Nel A, Xia T, Madler L. and Li N. Science. 2006;311:622. doi: 10.1126/science.1114397. [DOI] [PubMed] [Google Scholar]
- Yazdi A S, Guarda G, Riteau N, Drexler S K, Tardivel A, Couillin I. and Tschopp J. Proc. Natl Acad. Sci. 2010;107:19449. doi: 10.1073/pnas.1008155107. [DOI] [PMC free article] [PubMed] [Google Scholar]
- Jin C-Y, Zhu B-S, Wang X-F. and Lu Q-H. Chem. Res. Toxicol. 2008;21:1871. doi: 10.1021/tx800179f. [DOI] [PubMed] [Google Scholar]
- Trouiller B, Reliene R, Westbrook A, Solaimani P. and Schiestl R H. Cancer Res. 2009;69:8784. doi: 10.1158/0008-5472.CAN-09-2496. [DOI] [PMC free article] [PubMed] [Google Scholar]
- Huyton T, Rossjohn J. and Wilce M. Immunol. Cell Biol. 2007;85:406. doi: 10.1038/sj.icb.7100089. [DOI] [PubMed] [Google Scholar]
- Trinchieri G. and Sher A. Nature Rev. Immunol. 2007;7:179. doi: 10.1038/nri2038. [DOI] [PubMed] [Google Scholar]
- Kawai T. and Akira S. Nature Immunol. 2010;11:373. doi: 10.1038/ni.1863. [DOI] [PubMed] [Google Scholar]
- Barton G M. and Kagan J C. Nature Rev. Immunol. 2009;9:535. doi: 10.1038/nri2587. [DOI] [PMC free article] [PubMed] [Google Scholar]
- Pandey S. and Agrawal D K. Immunol. Cell Biol. 2006;84:333. doi: 10.1111/j.1440-1711.2006.01444.x. [DOI] [PubMed] [Google Scholar]
- Taniguchi A. Biomaterials. 2010;31:5911. doi: 10.1016/j.biomaterials.2010.04.038. [DOI] [PubMed] [Google Scholar]
- Chen P, Migita S, Kanehira K, Sonezaki S. and Taniguchi A. Sensors. 2011;11:7219. doi: 10.3390/s110707219. [DOI] [PMC free article] [PubMed] [Google Scholar]
- Chen P, Kanehira K, Sonezaki S. and Taniguchi A. Biotechnol. Bioeng. 2012;109:3112. doi: 10.1002/bit.24583. [DOI] [PubMed] [Google Scholar]
- IARC Working Group on the Evaluation of Carcinogenic Risks to Humans . IARC Monographs on the Evaluation of Carcinogenic Risks to Humans. vol 93. Lyon, France: IARC; 2010. Carbon black, titanium dioxide and talc; pp. pp 193–275. [PMC free article] [PubMed] [Google Scholar]
- Okuda-Shimazaki J, Takaku S, Kanehira K, Sonezaki S. and Taniguchi A. Int. J. Mol. Sci. 2010;11:2383. doi: 10.3390/ijms11062383. [DOI] [PMC free article] [PubMed] [Google Scholar]
- Iavicoli I, Leso V. and Bergamaschi A. J. Nanomater. 2012;2012:015008. doi: 10.1155/2012/964381. [DOI] [Google Scholar]
- Park E-J, Yoon J, Choi K, Yi J. and Park K. Toxicology. 2009;260:37. doi: 10.1016/j.tox.2009.03.005. [DOI] [PubMed] [Google Scholar]
- Huang Y, Zhou H, Feng P, Zhou X, Wen H, Xie X, Shen H. and Zhu X. J. Exp. Clin. Cancer Res. 2010;29:92. doi: 10.1186/1756-9966-29-92. [DOI] [PMC free article] [PubMed] [Google Scholar]
- Chen G-Y.et al Biomaterials. 2012;33:6559. doi: 10.1016/j.biomaterials.2012.05.064. [DOI] [PubMed] [Google Scholar]


