
Figure 1.
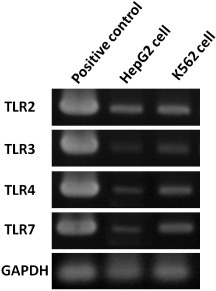
Expressions of TLRs in HepG2 and K562 cells. Electrophoresis was employed to analyze the products after RT-PCR amplification with TLR2, TLR3, TLR4, TLR7 and GAPDH (a housekeeping gene, control gene) in HepG2 (line 2) and K562 (line 3) cells. RNAs were extracted from the original HepG2 and K562 cells without NPs exposure. The positive control (TRLs cDNA) is shown in each panel (line 1).