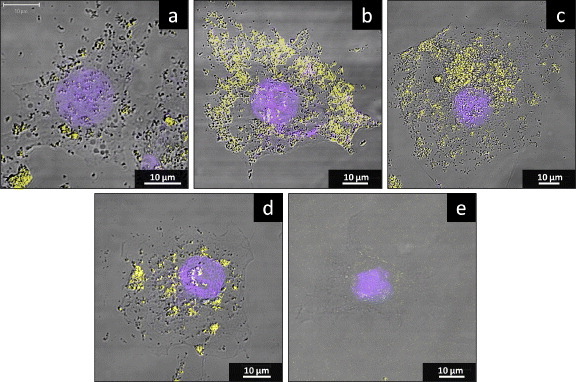
Figure 4.

The localization of TiO2 NPs in HepG2 cells in the presence or absence of TLR overproduction. HepG2 cells were mock transfected or transfected with the TLR-encoding expression vector. At 24 h after transfection, the cell culture medium was replaced with a medium containing 10 μg ml−1 TiO2 NPs and incubated for a further 24 h before staining for lysosomes (yellow) and nuclei (blue). Panels correspond to cells after (a) mock transfection or transfection with TLR3 (b) TLR4 (c) TLR7 (d) and encoding expression vector. Moreover, the cell without TiO2 NP exposure is also shown (e).
