Figure 7.

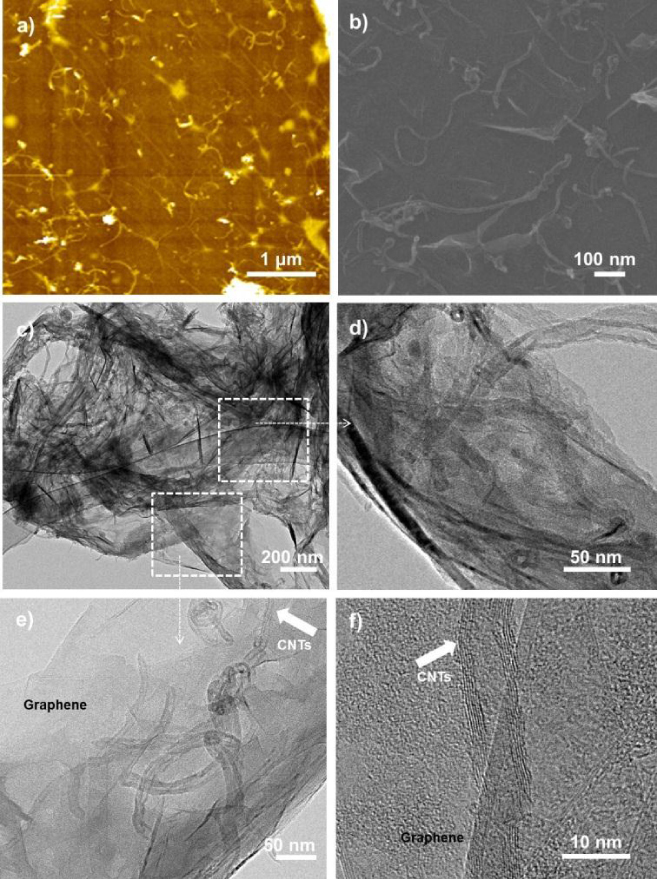
AFM and SEM images for CNT–G/Si (a and b) and TEM low and high resolution images (c–e) and (f) (arrows indicate a select region of the hybrid structure).

AFM and SEM images for CNT–G/Si (a and b) and TEM low and high resolution images (c–e) and (f) (arrows indicate a select region of the hybrid structure).