Figure 19.

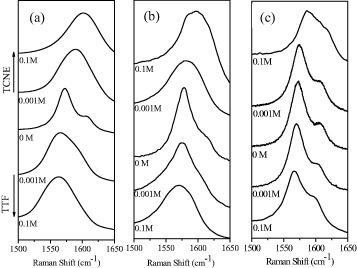
Variation in the Raman G-bands of graphene samples (a) EG, (b) DG and (c) HG, caused by interaction with varying concentrations of TTF and TCNE. (Reproduced with permission from [67] © 2009 Elsevier B. V.)

Variation in the Raman G-bands of graphene samples (a) EG, (b) DG and (c) HG, caused by interaction with varying concentrations of TTF and TCNE. (Reproduced with permission from [67] © 2009 Elsevier B. V.)