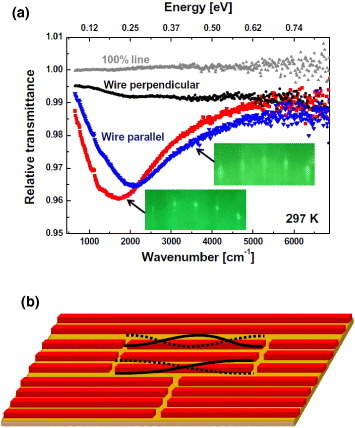
Figure 12.

(a) IR transmittance with electrical field polarized parallel (red squares and blue triangles) and perpendicular (black circles) to the indium atomic wires. The measurements were performed for two differently prepared samples. The 100% line (gray triangles) reveals the stability of the measurement system immediately before the experiment. (b) Schematic illustration of the finite-length indium atomic wires. The wires are segmented by domain boundaries and 1D plasmons are confined to form standing wave resonating modes. Dotted and solid curves schematically illustrate the standing wave 1D plasmons. (Only the fundamental mode is observed and the overtones are not identified in our study.)
