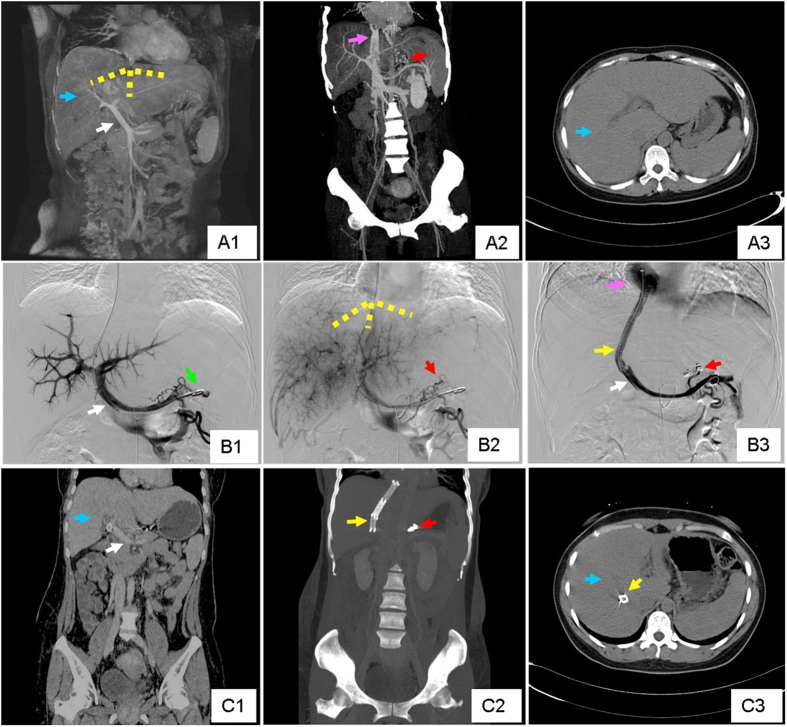
Figure 3. A representative case of acute BCS.
This was from a 40 y/o female patient, who suffered from rapidly progressive abdominal pain, digestive discomfort and severe jaundice. (A1,A2,A3) Coronal image of MRPV, coronal and transverse view of CT showed diffuse occlusion of three HVs and massive liver congestion. The yellow dotted line in (A1) outlined the original position of occluded HVs. The Blue arrows in (A1,A3) highlighted the congested liver tissue. The white arrow in (A1) illustrated the portal vein. The pink arrow in (A2) emphasized the inferior vena cava and the red arrows in (A2,B2) pointed to the gastric esophageal varices. (B1,B2) Early and late phase of angiography of portal vein revealed complete occlusion of HVs. (B3) Angiography of portal vein after TIPS. The white arrow in (B1) highlighted the portal vein on angiography, and the green arrow in (B1) pointed to the pigtail catheter performing portal vein angiography. The yellow dotted line in (B2) outlined the original position of occluded HVs which couldn’t be detected. The yellow arrow pointed to the TIPS canal which linked the portal vein (white arrow) and inferior vena cava (pink arrow). The red arrow in (B3) pointed to the embolized gastric esophageal varices. (C1,C2,C3) Coronal image, 3-D reconstruction and transverse view of CT 4 weeks after TIPS demonstrated the location of the stents, and a significant decrease in liver congestion. The blue arrows in (C1,C3) indicated obvious relief of liver congestion. The yellow and red arrow pointed to the TIPS stents and embolized gastric esophageal varices, respectively.

