Figure 3.

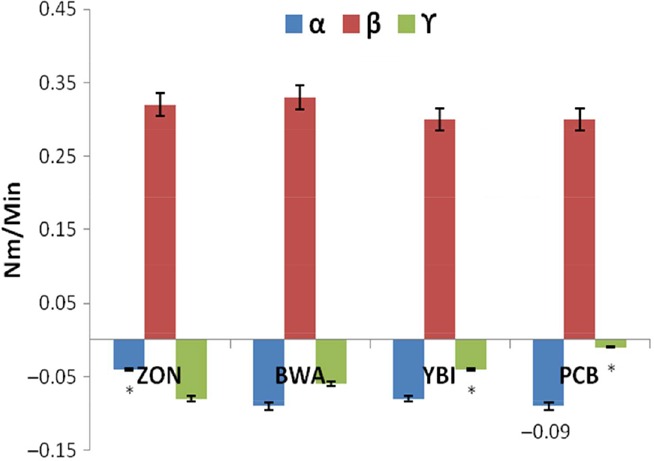
α, β and γ slopes of Mixolab curves of wheat and bambara–wheat composite doughs. Values = mean ±SD; n = 3. *Statistically significant at P < 0.05.

α, β and γ slopes of Mixolab curves of wheat and bambara–wheat composite doughs. Values = mean ±SD; n = 3. *Statistically significant at P < 0.05.