-
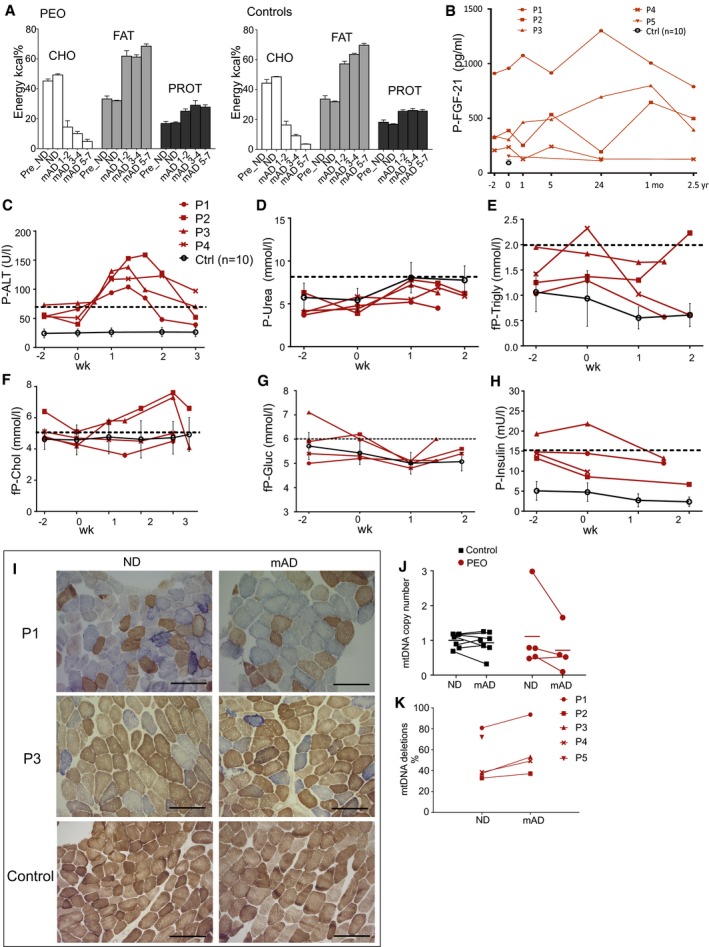
A
Isocaloric mAD composition in PEO patients and control subjects. The amounts of fat, carbohydrates, and proteins are represented as kcal% from the total daily energy expenditure. Values shown as mean and SEM.
-
B
Plasma FGF‐21 levels in individual patients and in grouped controls (n = 10) shown as mean ± SD.
-
C–H
Plasma levels of alanine aminotransferase (P‐ALT), urea, triglycerides, cholesterol, glucose and insulin in PEO patients and control subjects. Controls (n = 10) are shown as mean ± SD. Dashed line: upper limit of control range.
-
I
COX‐SDH histochemical activity analysis on frozen sections from quadriceps femoris muscle of the PEO patients in normal diet (ND) and after modified Atkins diet (mAD). Scale bar, 150 μm.
-
J
Skeletal muscle, relative mtDNA amount compared to nuclear single‐copy APP gene.
-
K
mtDNA deletion load as a percentage from total mtDNA in PEO muscle.
Data information: Abbreviations: mo, month; yr, year; fP, fasted plasma; COX, cytochrome c oxidase; SDH, succinate dehydrogenase.