
Figure 4. Transcriptomic analysis of PEO muscle, before and after mAD .
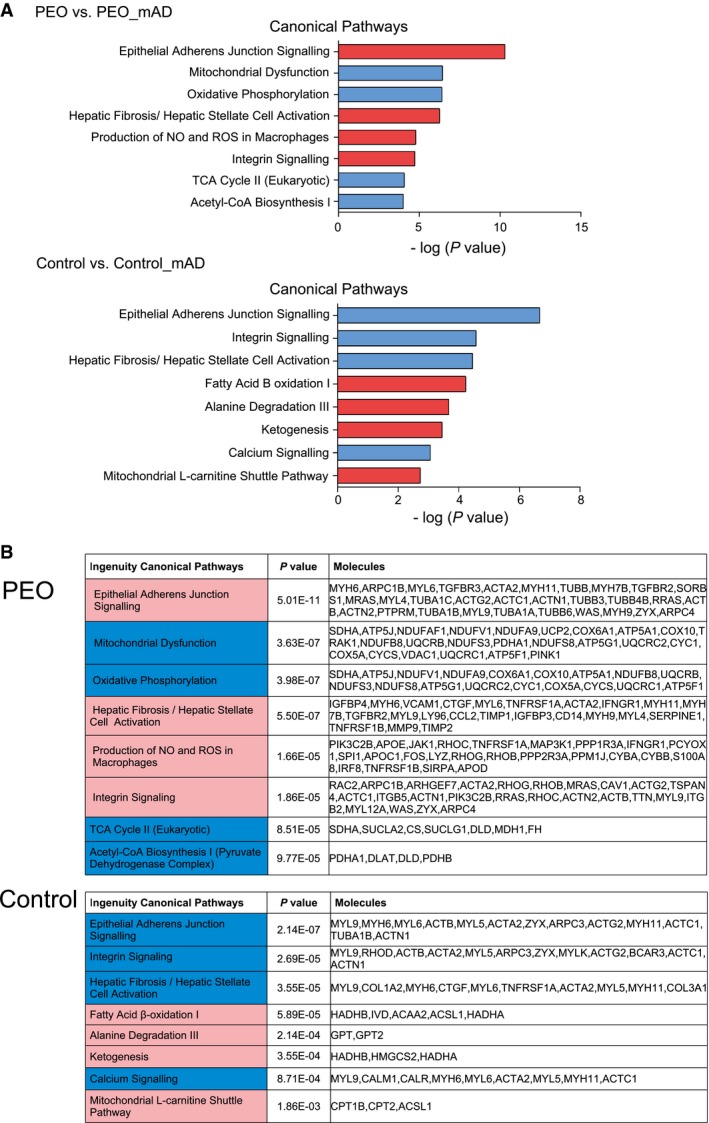
- Most significantly altered transcriptomic pathways in PEO muscle (n = 4) and in control subjects muscle after mAD (n = 8). Blue color represents down‐regulated and red color represents up‐regulated pathways.
- Genes, the expression levels of which formed the pathway results in (A). Statistical test: Benjamini‐Hochberg multiple testing.