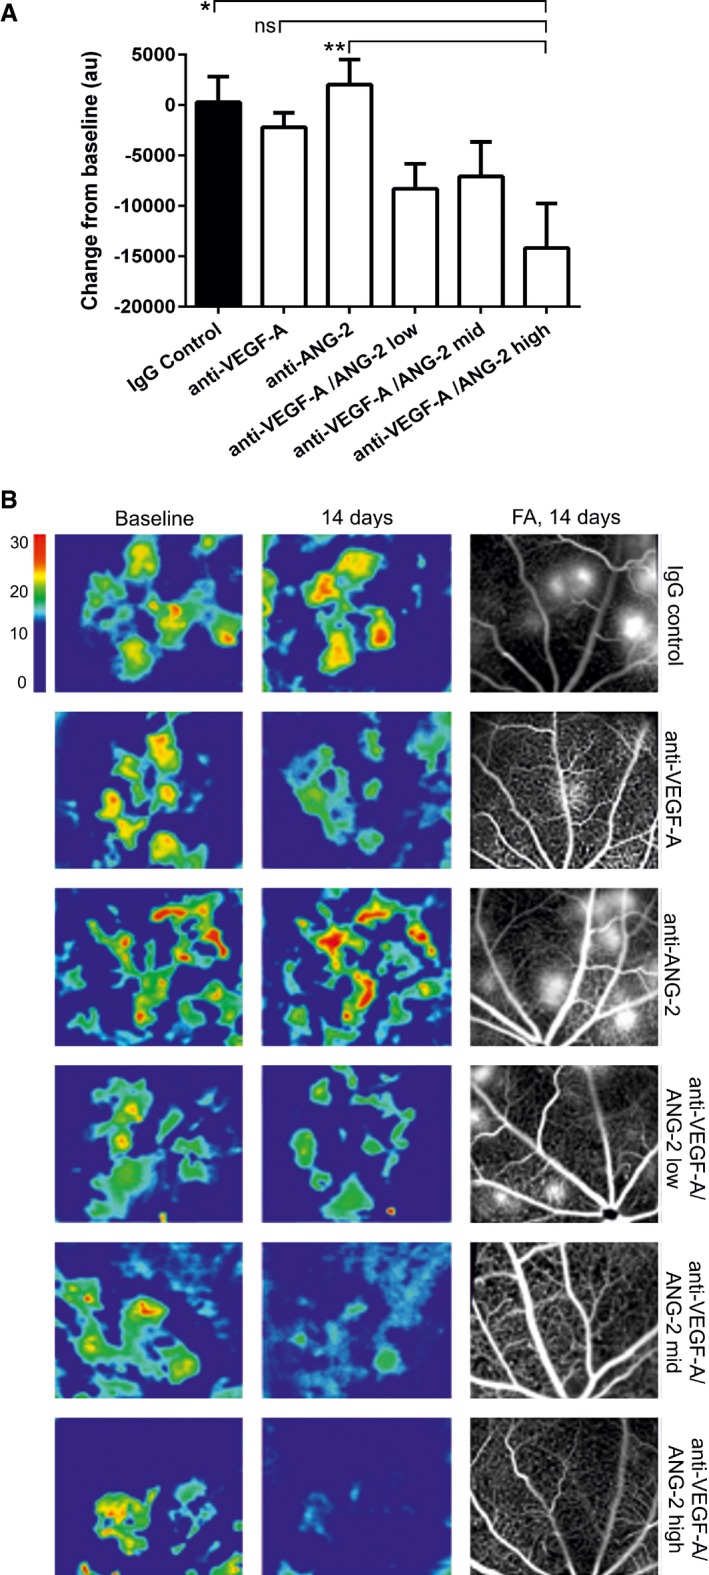
Bar graph showing the relative change in OCT‐measured volume between the outer nuclear layer and the RPE layer following intervention with test item. anti‐VEGF‐A and anti‐ANG‐2 were given at 5 mg/kg and anti‐VEGF‐A/ANG‐2 at 1, 5, and 10 mg/kg (low, mid, and high dose).
Representative OCT images converted to heat maps with the scaling grade given on the right of the figure delineating fluid‐filled areas of the retina. Baseline (D46) and 14‐day treatments of IgG control, Anti‐VEGF‐A, anti‐ANG‐2, and bispecific anti‐VEGF‐A/ANG‐2 at the end of the experiment (D60) are shown. For the region of interest, the corresponding FA image at D60 is also shown as comparator.
Data information: SEM is shown as error bars with
n = 6 animals per group; significance is shown by * using one‐sided ANOVA (
P = 0.0048) followed by Tukey's multiple
t‐test. Significant changes are shown with anti‐VEGF‐A/ANG‐2 high vs. anti‐ANG‐2 (**,
P = 0.0069) and IgG control (*,
P = 0.018). In addition, the comparison of anti‐VEGF‐A vs. anti‐VEGF‐A/ANG‐2 (high) is approaching significance (ns,
P = 0.072). FA, fluorescein angiography; OCT, optical coherence tomography; RPE, retinal pigment epithelium; vs., versus.

