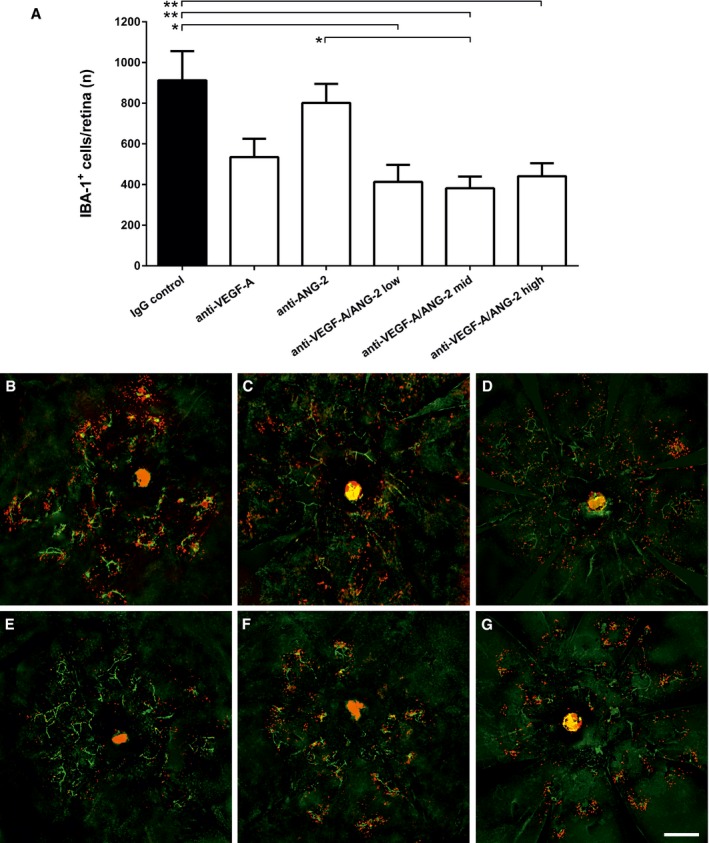
ABar graph of number of IBA‐1+ cells in the retina of mice treated with IgG control, anti‐VEGF‐A, anti‐ANG‐2 (all 5 mg/kg IP), or bispecific anti‐VEGF‐A/ANG‐2 (at 10, 5, and 3 mg/kg) in the late interference model at D60. Error bars show SEM with n = 6 animals per group. All significant differences are shown by * after one‐sided ANOVA (P < 0.0008) and Tukey's multiple t‐test. IgG control is significantly different vs. anti‐VEGF‐A/ANG‐2 low (*, P < 0.0134), mid (**, P < 0.0078), and high (**, P < 0.0042); furthermore, anti‐ANG‐2 is significantly different vs. anti‐VEGF‐A/ANG‐2 mid (*, P < 0.0353).

