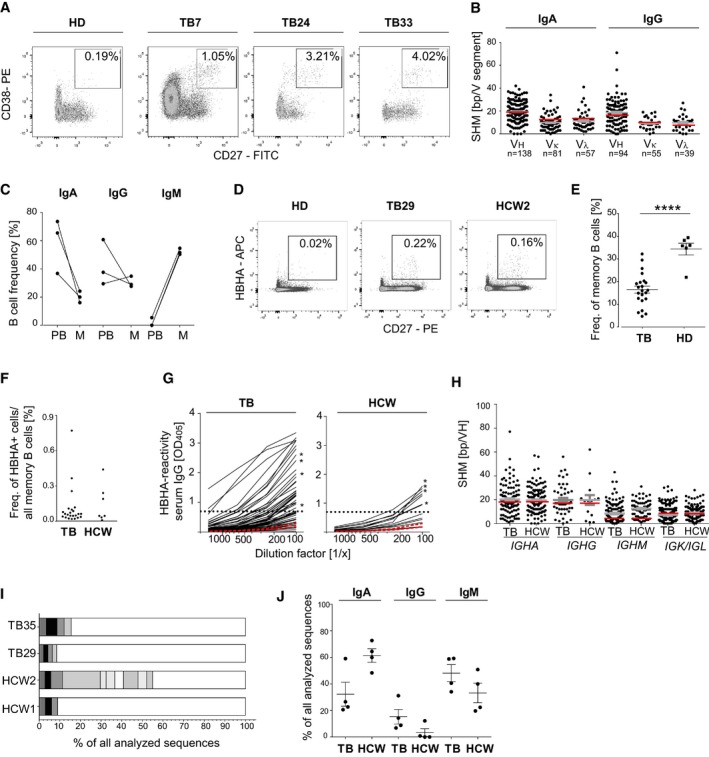
Gating strategy, phenotype, and frequency of circulating plasmablasts (CD19+CD27++CD38+) isolated by flow cytometric cell sorting from three TB patients (TB7, TB24, and TB33) in comparison with one representative HD. Boxes indicate sort gates. The plasmablast frequency is indicated.
Absolute number of somatic hypermutations (SHM) in the
IGHV,
IGKV, and
IGLV segments of IgA and IgG plasmablast antibody genes sequenced from TB7, TB24, and TB33. The absolute number of sequences analyzed is indicated below the graph. Geometric means with SEM are indicated in gray. SHM means of historic data from sorted CD27
+IgA
+ or CD27
+IgG
+ cells from the peripheral blood of HD are indicated in red for comparison (Tiller
et al,
2007; Berkowska
et al,
2015).
Isotype distribution of plasmablast and memory B cells from TB7, TB24, and TB33. PB, plasmablasts (CD19+CD27++CD38+); M, memory B cells (CD19+CD27+).
Gating strategy, phenotype, and frequency of HBHA‐reactive memory B cells (CD19+CD27+HBHA+) in the peripheral blood of one representative TB patient (TB29), healthcare worker (HCW) 2, and HD, respectively.
Dots indicate the frequency of HBHA‐reactive memory B cells out of all CD27+ memory B cells in individual TB patients (n = 23) and HCW (n = 7). Mean and SEM are indicated. P‐value was determined using Wilcoxon–Mann–Whitney test; ****P < 0.0001.
Dots indicate the frequency of resting memory B cells (CD19+CD27+CD10−) out of all B cells in the peripheral blood of individual TB patients compared with HCW.
Anti‐HBHA serum IgG ELISA reactivity for TB patients and HCW (black lines) compared with two representative HDs (red lines). Dashed line indicates the threshold OD405 nm for positive reactivity. Asterisks indicate the serum responses of donors selected for single sorting of HBHA‐reactive memory B cells. Data are representative of two independent experiments.
Absolute number of somatic hypermutations (SHM) in the IGHV (
IGHA, IGHG, and
IGHM),
IGKV, or
IGLV segments of sorted anti‐HBHA memory cells from TB patients and HCW. Geometric means with SEM are indicated in gray. For comparison, red lines indicate the historic SHM means for randomly sorted CD27
+IgA
+, CD27
+IgG
+, or CD27
+IgM
+ cells from the peripheral blood of HDs (Tsuiji
et al,
2006; Tiller
et al,
2007; Berkowska
et al,
2015).
The number and size of clonally expanded B‐cell clusters among HBHA‐reactive memory B cells from two TB patients (TB35 and TB29) and HCW (HCW1 and HCW2). Cells in clusters are indicated in gray, and single cells are indicated in white. No B‐cell clusters were shared between donors.
IgA, IgG, and IgM isotype distribution of single‐cell‐sorted HBHA‐reactive memory cells. Mean and SEM are indicated.

