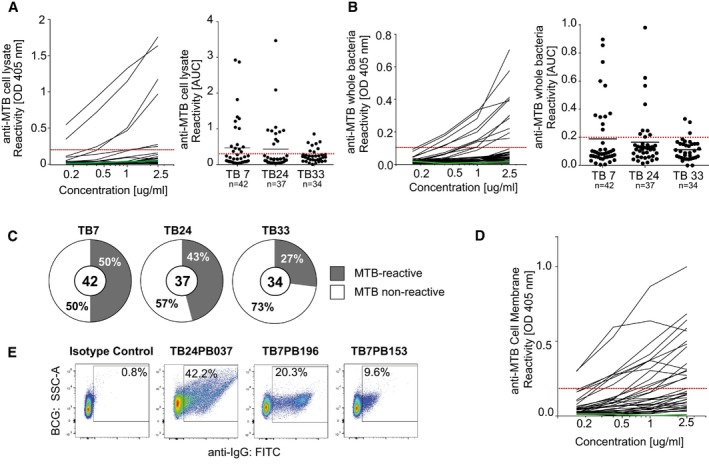
Figure 3. Peripheral plasmablast antibodies from TB patients bind to mycobacterial surface antigens.

-
A, BRepresentative ELISA graphs show the reactivity of antibodies from patient TB7 to (A) MTB whole‐cell lysate or (B) MTB bacteria (left). Dashed red line indicates the threshold OD405 nm for positive reactivity. Green line indicates the negative control antibody (mGO53; Wardemann et al, 2003). AUC (area under curve) values indicate the reactivity to (A) MTB cell lysate or (B) whole MTB bacteria for antibodies from TB7, TB24, and TB33. The total numbers of analyzed antibodies are indicated (right).
-
CPie charts show the frequency of MTB‐reactive (gray) vs. nonreactive (white) antibodies as measured by whole‐cell lysate and MTB bacteria ELISA for each patient. MTB‐reactive antibodies were positive in both or one of the assays. The total numbers of analyzed antibodies are indicated in the center of the charts.
-
DELISA graph shows the reactivity to the MTB cell membrane fraction for MTB‐reactive (n = 26) and nonreactive (n = 14) antibodies.
-
EReactivity to whole BCG bacteria as determined by flow cytometry for three representative MTB cell lysate‐reactive antibodies and one nonreactive antibody (isotype control, mGO53).
