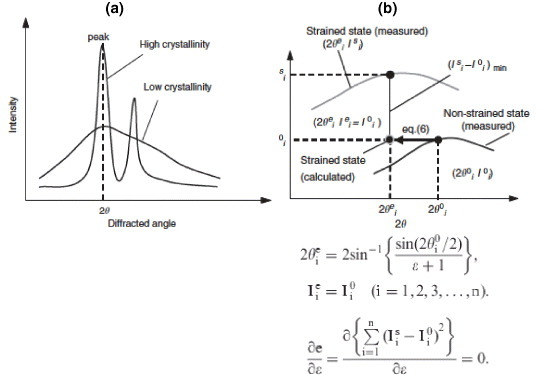
Figure 4.

(a) An illustration of x-ray diffraction profiles showing that materials with high crystallinity have sharper peaks compared to low-crystallinity materials. The profile of mineral crystals in bone tissue is broad mainly because of low crystallinity. (b) Profile-shift method: the strained state point is estimated from non-strained state profile and compared to the strain state profile. Differences between the estimated and measured points on the strained state profile were used for strain evaluation. (Reprinted with permission from [44] © 2006 Elsevier Ltd.)
