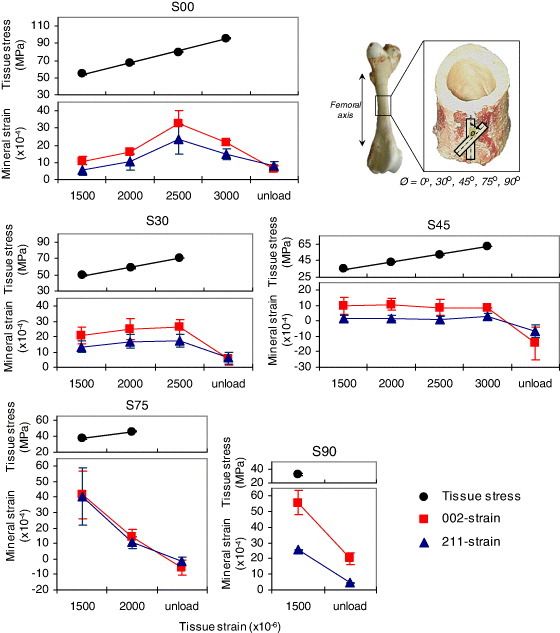
Figure 7.

Tissue stresses and mineral strains plotted for different applied strains and structural anisotropy cases. The straight lines for the tissue stresses represent linear fits (within R2=0.99). The figure presents variations in the deformation characteristics of mineral crystals. The error bars represent standard deviations for different trial combinations. (Plots reprinted with permission from [65] © 2009 Elsevier Ltd.)
