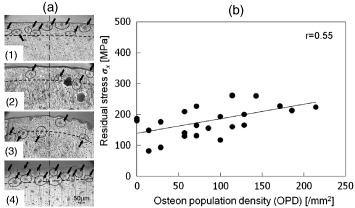
Figure 10.

(a) Microscopic images showing the x-ray measurement positions in the hindlimb bones: (1) anterior in the femur, (2) posterior in the femur, (3) anterior in the tibia and (4) posterior in the tibia of the same limb. The top part of the images shows the outer side of the diaphysis. The dashed lines show a depth from the surface of about 100 μm, and the black arrows indicate osteons. (b) Relationship between the residual stress and the OPD in the rabbit limb bones. The correlation is positive (r=0.55, P<0.01). (Reprinted with permission from [78] © 2010 Elsevier Ltd.)
