
Figure 5. Genomewide differential expression RNA‐Seq analysis between treatments.
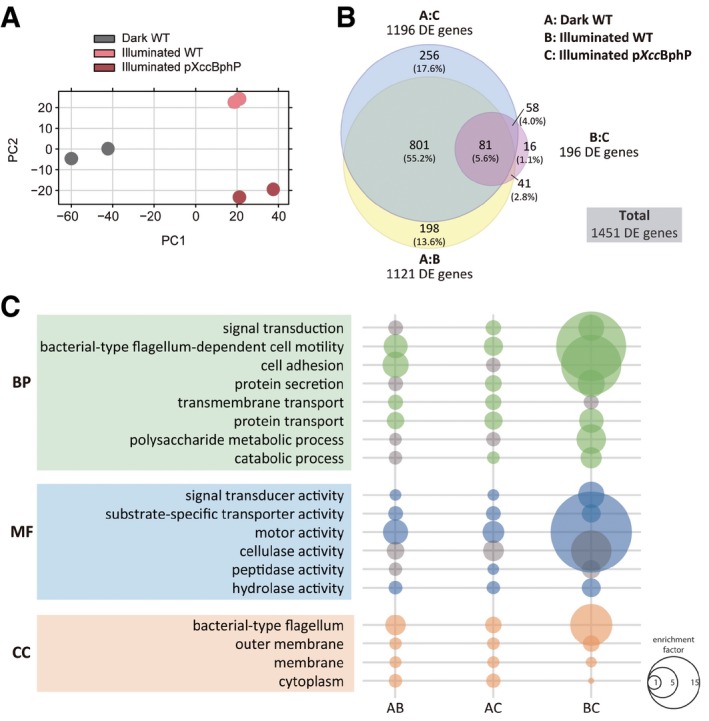
- Principal component analysis (PCA) plot of the first two components of the analyzed samples showing separation between the three treatments: far‐red illuminated wild‐type, far‐red illuminated pXccBphP (XccBphP overexpressing), and dark wild‐type Xcc treatments.
- Venn diagram showing overlap of differentially expressed (DE) genes between treatments (P‐values < 0.05), bubbles are drawn to scale. A total of 1,451 DE genes were found in comparisons between all treatments and relative percentages to this number are indicated.
- Gene Ontology (GO) enrichment analysis. GO enrichment was evaluated at three different levels: biological processes (BP), molecular function (MF), and cellular component (CC). Relevant categories showing enrichment of DE genes are depicted. Bubble size correlates with enrichment factor values; gray bubbles represent P‐values > 0.05.