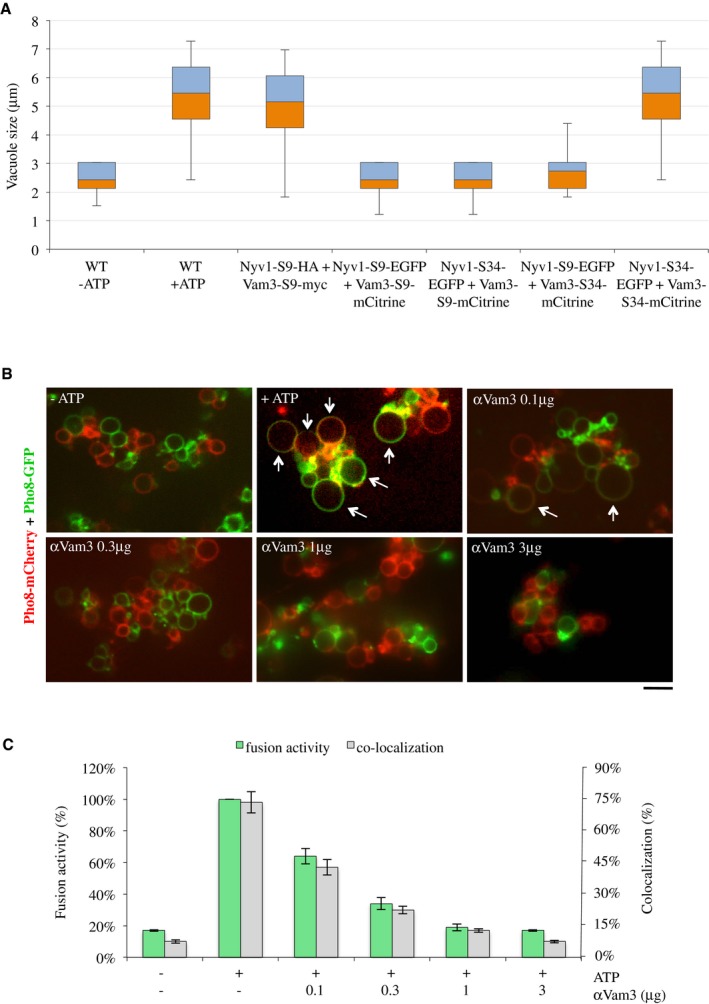
Figure EV1. Assay of fusion by microscopy and content mixing.

- Distribution of vacuole diameters. Vacuoles were isolated from the indicated strains and used in in vitro fusion reactions. At the end of the reaction, the organelles were analyzed by fluorescence microscopy and vacuole diameters were measured. Only structures that were identifiable as vesicular entities were analyzed. Data are represented as a box‐and‐whisker plot. The boxes provide the median, the upper (blue) and lower (orange) quartile. Whiskers represent the maximal and minimal values observed, respectively. 20 vacuoles have been analyzed for each condition in three independent experiments each.
- Microscopy: Vacuoles were isolated from BJ3505 cells expressing Pho8‐EGFP or Pho8‐mCherry. Ten micrograms of vacuoles was incubated in standard fusion reactions in the absence or presence of ATP with increasing amounts of anti‐Vam3 antibody and analyzed by confocal microscopy. Arrows indicate the products of vacuole fusion. Scale bar: 5 μm.
- Comparison of fusion activity measured through content mixing or the degree of colocalization of vacuolar fluorescent marker proteins, using BJ3505 vacuoles and DKY6281 vacuoles that did not carry tags on their SNARE proteins. Vacuole fusion was assessed by measuring, from parallel fusion reactions, either content mixing by the standard Pho8/Pep4 maturation assay or the colocalization between Pho8‐EGFP and Pho8‐mCherry signals. Reactions were performed in the absence or presence of ATP and with increasing amounts of anti‐Vam3 antibody used as a potent inhibitor of fusion reaction. Means ± s.d. are shown from three independent experiments.
