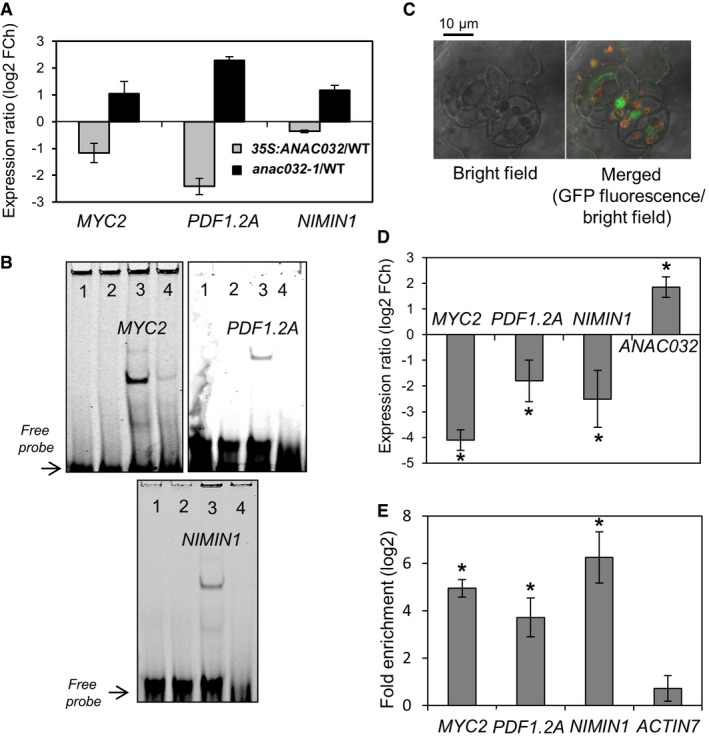
MYC2, PDF1.2A and NIMIN1 expressions in ANAC032 transgenics compared to WT after spraying with Pst DC3000 (24 hpi) normalized to their respective controls. FCh, fold change. Means ± SD (n = 3 independently performed experiments, each including the rosette leaves of at least three plants grown in individual pots).
EMSA showing binding of ANAC032 to MYC2, PDF1.2A and NIMIN1 promoter regions (in 5′‐DY682‐labelled double‐stranded oligonucleotides) harbouring ANAC032 binding sites. 1, labelled probe only; 2, labelled probe plus GST protein; 3, labelled probe plus ANAC032‐GST protein; 4, labelled probe, ANAC032‐GST protein and 100× competitor (unlabelled oligonucleotide containing ANAC032 binding site).
Confocal microscope image showing nuclear localization of ANAC032‐GFP fusion protein expressed from the ANAC032 promoter in ANAC032
prom
:ANAC032‐GFP/anac032‐1 seedlings treated with Pst at 6 hpi. Left, bright field; right, chlorophyll auto‐fluorescence (red) and GFP fluorescence (green) under bright field.
Expression of MYC2, PDF1.2A, NIMIN1 and ANAC032 in 5‐week‐old ANAC032
prom
:ANAC032‐GFP/anac032‐1 plants compared to WT at 6 hpi with Pst, normalized to their respective controls. FCh, fold change. Means ± SD (n = 3 independently performed experiments, each including the rosette leaves of at least three plants grown in individual pots). Asterisks indicate a significant difference from WT, normalized to their respective controls (*P < 0.05; Student's t‐test).
ChIP‐qPCR shows enrichment of MYC2, PDF1.2A and NIMIN1 promoter regions containing ANAC032 binding site compared to a promoter region lacking the ANAC032 binding site (AT5G09810; ACTIN7). Means ± SD (n = 3 independently performed experiments, each including the rosette leaves of at least three plants grown in individual pots). Asterisks indicate a significant difference from negative control (*P < 0.01; Student's t‐test).

