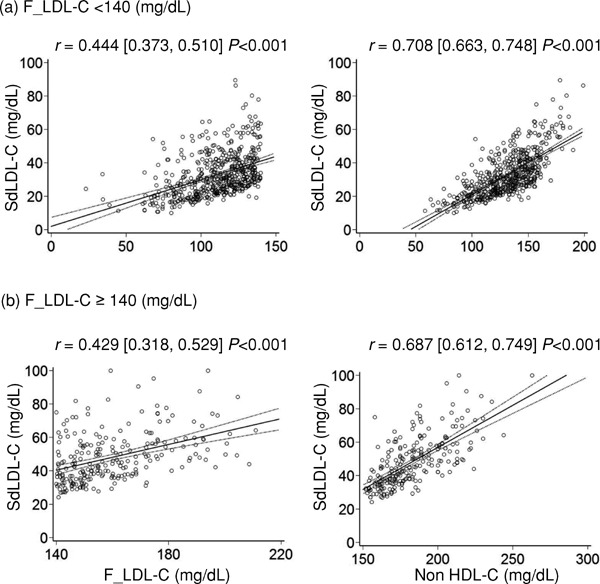
Fig. 6.

Scatter plots and regression lines with 95% CIs for comparisons of sdLDL-C and lipid parameters when subjects were stratified by F_LDL-C levels
Pearson's correlation coefficient with 95% CIs is indicated on the graph.
sdLDL-C, small-dense low-density lipoprotein cholesterol; F_LDL-C, low-density lipoprotein cholesterol calculated using the Friedewald formula; non-HDL-C, non-high-density lipoprotein cholesterol; CIs, confidence intervals
