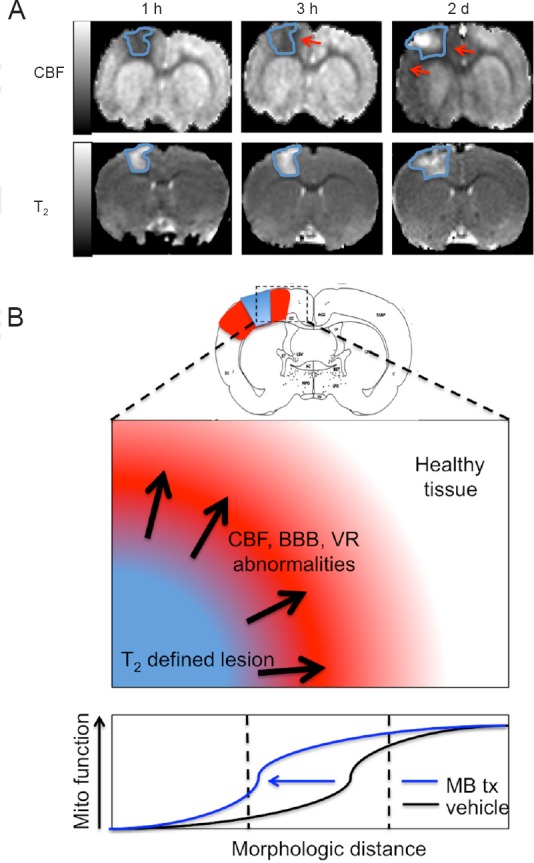
Figure 1.

Cerebral blood flow (CBF) abnormality exceeds T2 defined lesion volume.
(A) Representative CBF and T2 maps (150 × 150 × 1,000 μm) of 1 slice at 1 and 3 hours and 2 days after TBI from one animal. The T2 lesion is outlined in blue and is overlaid in the CBF map to demonstrate the extent of abnormality between the two measures. Red arrows indicate the areas of CBF abnormality that extend beyond the T2 lesion. Hypoperfusion is apparent at 1 and 3 hours. On day 2, hyperperfusion was detected in the center of impact and widespread hypoperfusion remained peripheral to the impact zone and exceeds the T2 defined lesion volume (adapted from Long et al., 2015). (B) Hypothesized alteration of stimulating mitochondrial metabolism with methylene blue following TBI. The extent of CBF, BBB, and VR abnormalities may be mitigated by stimulating mitochondrial metabolism thereby reducing the extent of these alterations and reducing lesion volume and functional deficits. TBI: Traumatic brain injury; BBB: blood-brain barrier; VR: vasoreactivity. h: hour(s); d: days.
