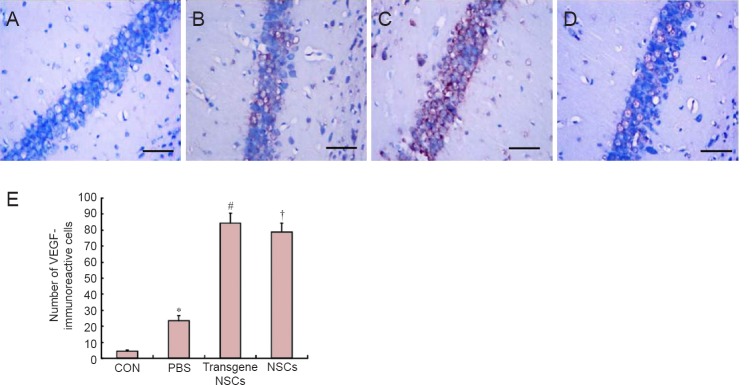
Figure 3.
VEGF immunoreactivity in the affected brain region post HIBD in the different groups.
(A–D) VEGF immunoreactivity in CON, PBS, transgene NSCs and NSCs groups. Scale bars: 20 µm. (E) The quantification of VEGF-immunoreactive cells was performed by immunohistochemical staining of the hippocampal region in hypoxic-ischemic ipsilateral hemispheres. Data are expressed as the mean ± SD (12 rats in each group). The data for the different groups were compared using one-way analysis of variance followed by Tukey's honestly significant difference test when an overall significance was detected. *P < 0.05, vs. CON group; #P < 0.05, vs. NSCs group or PBS group; †P < 0.05, vs. PBS group. NSCs: Neural stem/progenitor cells; CON: sham-operated control; PBS: phosphate-buffered saline; HIBD: hypoxic-ischemic brain damage; VEGF: vascular endothelial growth factor.

