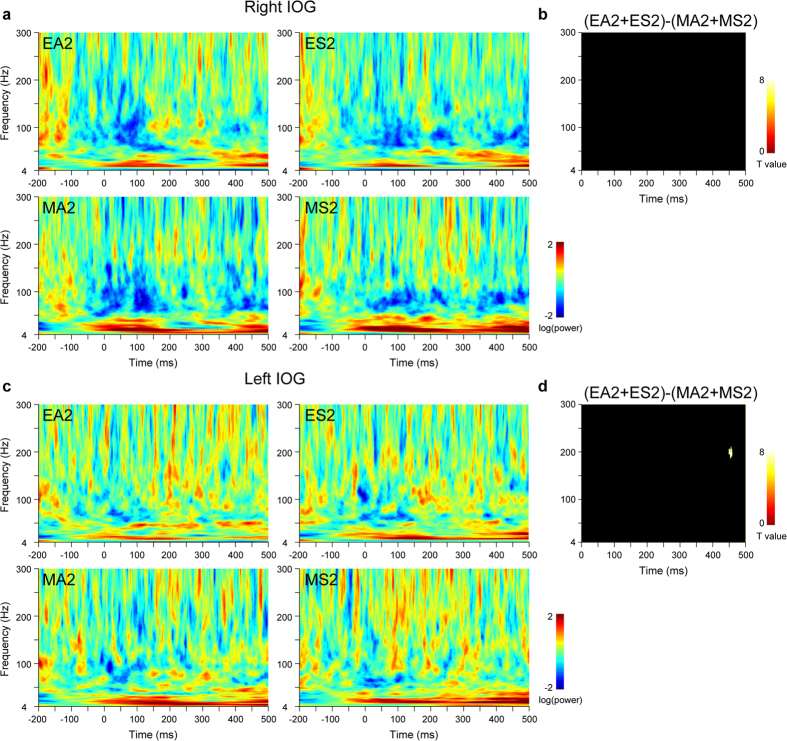
Figure 4. Time–frequency maps of activity in the inferior occipital gyrus (IOG) for the second stimulus presentations.
(a) Time–frequency maps of right IOG activity. EA = averted eyes; ES = straight eyes; MA = averted mosaics; MS = straight mosaics; 2 = second stimulus presentation. (b) Statistical parametric maps for the contrast of eyes versus mosaics in right IOG activity. p < 0.05 cluster-level family-wise error (FWE)-corrected. (c) Time–frequency maps of left IOG activity. (d) Statistical parametric maps for the contrast of eyes versus mosaics in left IOG activity. p < 0.05 cluster-level FWE-corrected.

