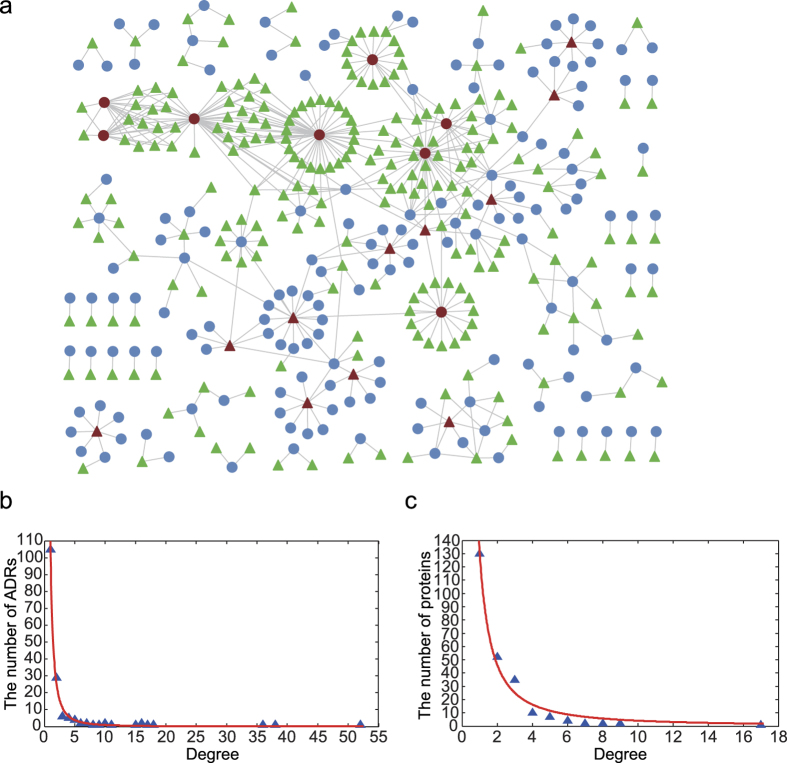
Figure 2. Visualization and characteristics of the protein-ADR network.
(a) The protein-ADR network. If one protein was related to one ADR, they were linked by an edge. The protein and ADR nodes were shown by green triangles and blue circles, respectively. We colored the hub nodes red. The hub nodes were defined as the top 5 percent of proteins and ADRs with the highest degree. (b,c) Degree distribution of the ADR and protein nodes, respectively.

