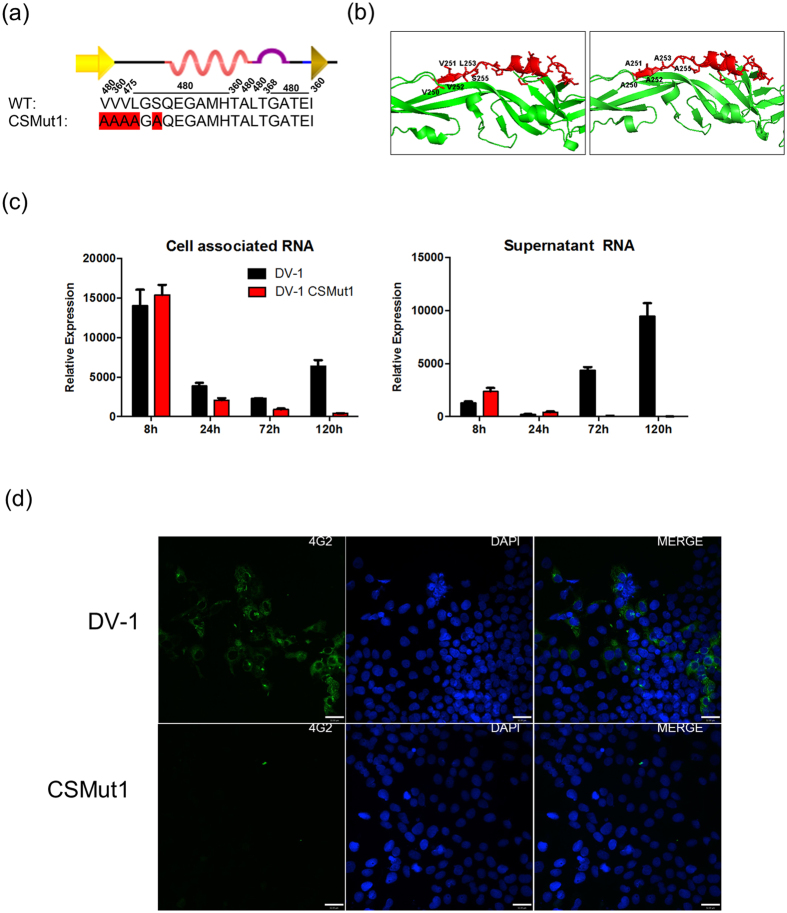
Figure 3. CSMut1 design, modelling and infectivity.
(a) The wild type E250–270 and CSMut1 sequences are shown with mutated amino acids highlighted in red. (b) Wild type (on the left) and CSMut1 model (on the right) with E250–270 in red. (c) Relative quantification of DV NS5 RNA in Huh7.5 cells transfected with wild type and CSMut1 genomes at different time points. Cell associated RNA is shown in the left panel and supernatant extracted RNA in the right panel. (d) DV E-protein immunofluorescence staining of WT and CSMut1 120 hours after genome transfection in Huh7.5 cells (bars correspond to 32 μM).

