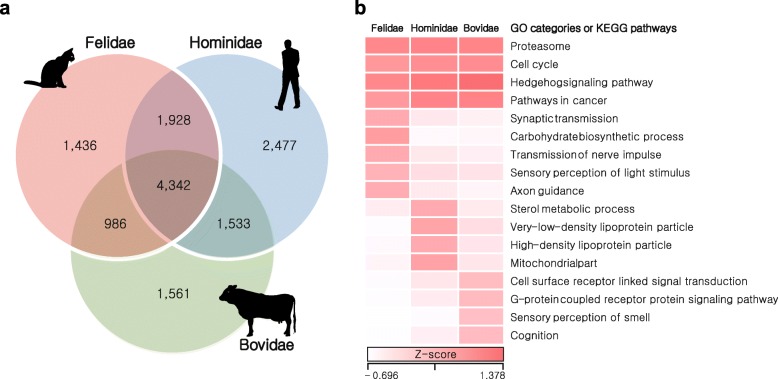
Fig. 3.
HCRs in Felidae, Hominidae, and Bovidae. HCRs in the same family species were identified by calculating the ratios between numbers of conserved and non-conserved positions. a Venn diagrams of genes in the HCRs. b Heatmap of enriched gene ontology (GO) categories or KEGG pathways in the HCRs. Z-scores for the average fractions of homozygous positions are shown as a white-to-red color scale

