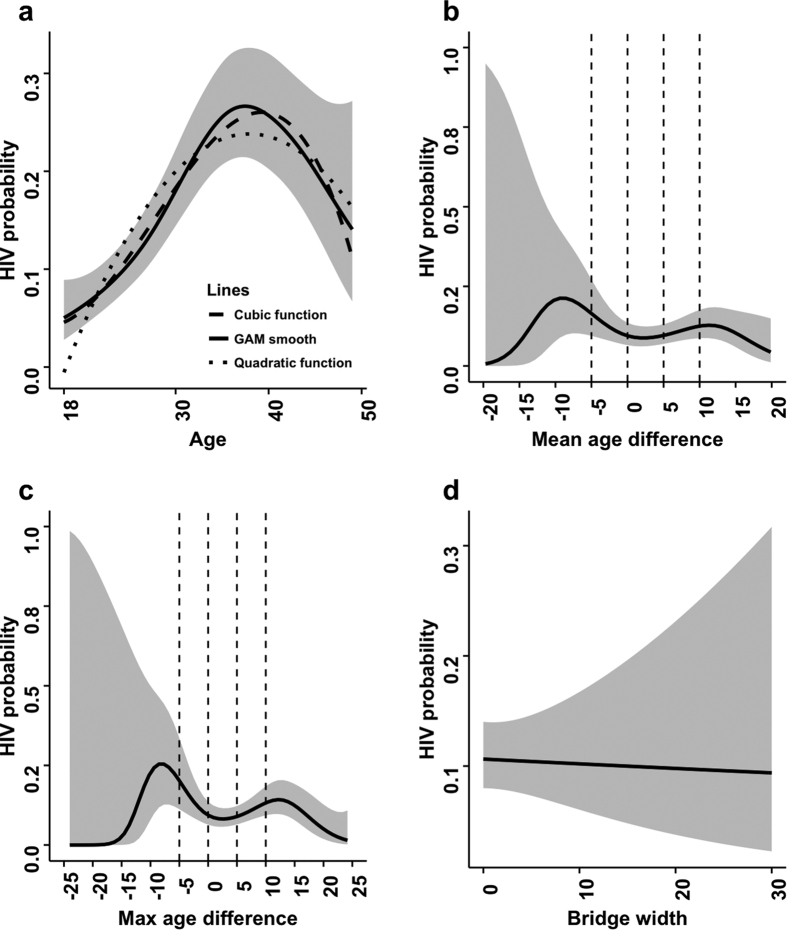
Figure 2. Smoothed plots showing the probability of being HIV-positive among women.
The model in panel (a) is univariate and used to demonstrate the functional form that age should take in the regression models. The confidence bands presented result from the GAM. Models in panels (b) to (d) adjust for age, age squared, age cubed, and total number of partners in the past 5 years. For comparison purposes, the chosen cut-points to categorize the age difference measure from the parametric analysis are indicated by vertical dashed lines.

