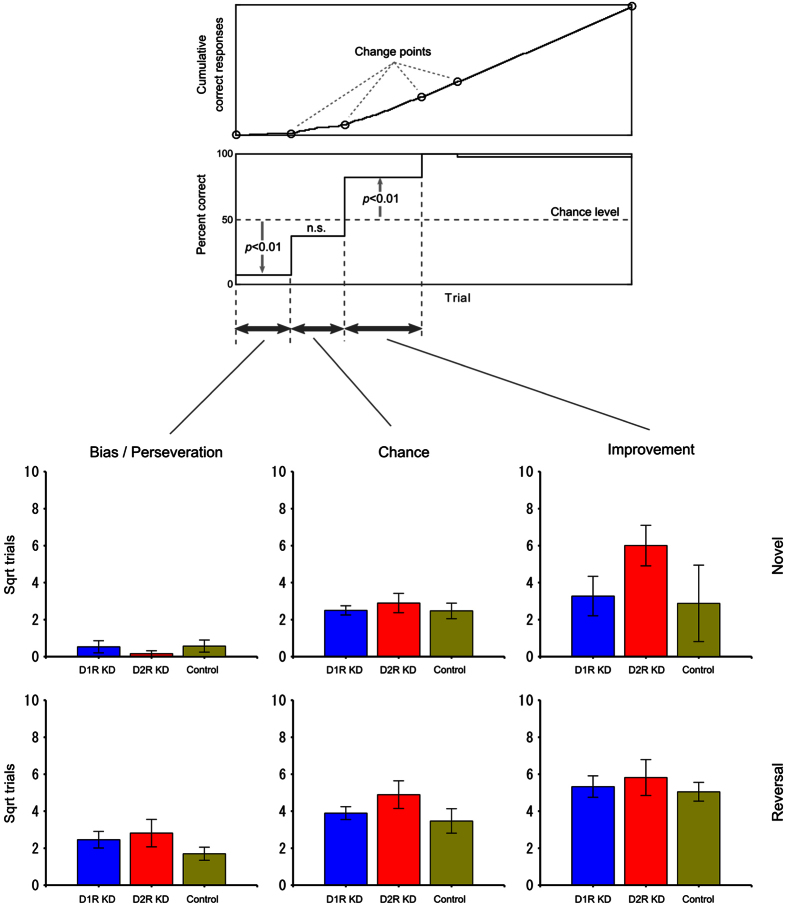
Figure 4. Comparison of the number of trials at various stages of learning.
Top panels: The three stages were identified using the method of Takemoto et al.66. The “bias/perseveration” stage was also defined in the present study as the interval from the first trial to the last trial in which the correct ratio was significantly below the level of chance (α = 0.01). Bottom panels: The mean square roots of the number of trials at the three learning stages are plotted against the experimental groups. The blue, red, and yellow bars represent the results from D1R KD, D2R KD, and control marmosets, respectively. The upper and lower rows show the results of novel visual discrimination and reversal learning, respectively. The error bars represent SEM (±). For all learning stages in novel and reversal learning, the square root of the number of trials among the three groups was compared using one-way ANOVA. As shown in the Table 3 and Fig. 3 of original paper66, the wild type marmosets could learn in very early onset trails when once they start to learn.

