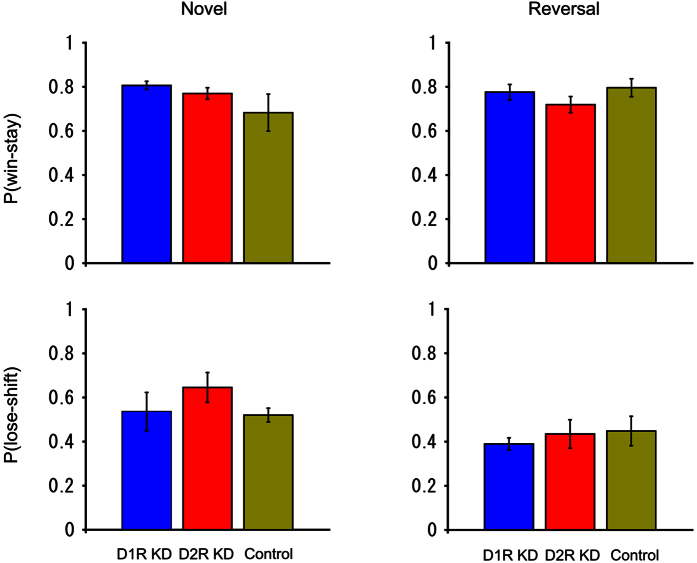
Figure 5. Win-stay/lose-shift analysis.
The upper panels represent the win-stay probabilities and the lower panels show the lose-shift probabilities. The left and right panels display the results in the novel and reversal learning, respectively. The blue, red, and yellow bars represent the results from D1R KD, D2R KD, and control marmosets, respectively. For each marmoset, the probabilities were calculated using the trial data at all three learning stages (described in Fig. 4) in the four repeats for novel and reversal learning. The probabilities were then averaged across animals. The error bars represent SEM (±). The win-stay and lose-shift probabilities among the three groups were compared using one-way ANOVA.

