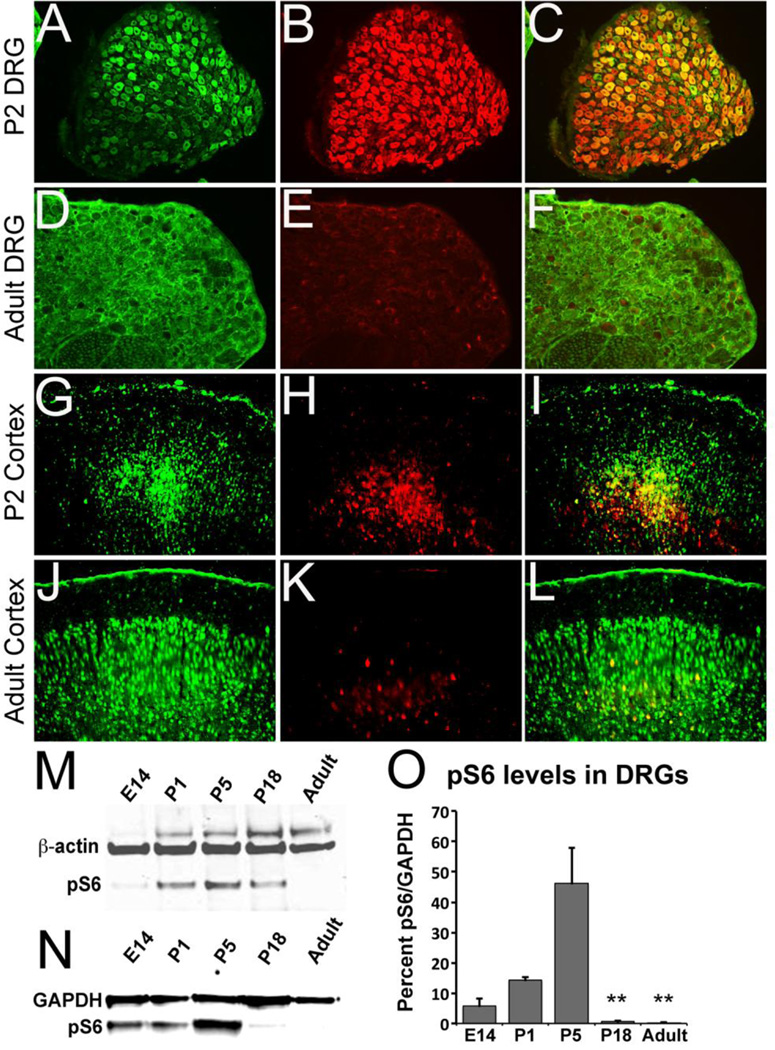
Figure 2. Developmental activation of mTor pathway by surveillance of ribosomal subunit S6 phosphorylation.
A–F: Transverse sections of normal postnatal day 2 DRG (A–C) and adult DRG (D–F) showing NF-M (A, D) and pS6 (B, E) staining and merged images (C, F). G–L: Coronal section of cortex from postnatal day 2 (G–I) and adult rats (J–L) showing NeuN (G, J) and pS6 (H, K) staining and merged images (I, L). Western blot analysis of pS6 expression in embryonic day 14 (E14), postnatal day 1 (P1), 5 (P5), 18 (P18) and adult rat DRGs (M), and cortical tissues (N). DRG or cortical tissues were homogenized and lysates were analyzed using rabbit anti-pS6 antibody with β-actin as loading control. Quantitative analysis of pS6 bands shows a significant decrease in density between P1 and P18 or Adult and P5 and P18 or Adult (** p<0.05). Scale Bars: 500 µm (A–F) and 1000 µm (G–L).

