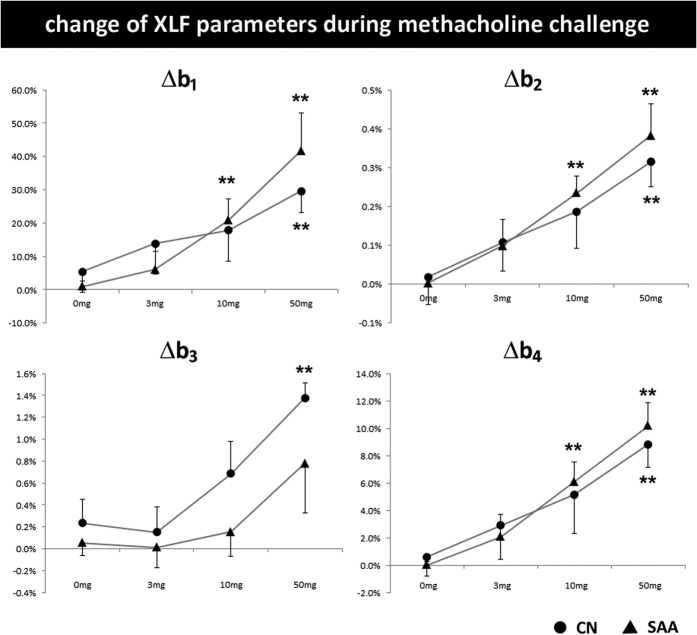
Figure 3. Airway responsiveness to methacholine as measured by XLF.
Relative change of XLF parameters to baseline values are shown for SAA and CN in dependence of increasing concentrations of methacholine (0, 3, 10, and 50 mg/ml). In SAA animals b1, b2 and b4 are significantly affected by a lower concentration of methacholine (10 mg/ml) than CN (50 mg/ml) relative to 0 mg/ml (**p < 0.05).

