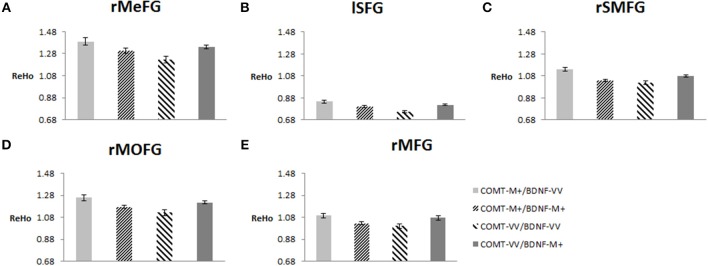
Figure 4.
Effects of COMT and BDNF on mean ReHo of each ROI (N = 298). (A) right medial frontal gyrus (rMeFG); (B) left superior frontal gyrus (lSFG); (C) right superior and medial frontal gyrus (rSMFG); (D) right medial orbitofrontal gyrus (rMOFG); (E) right middle frontal gyrus (rMFG). For all five regions of interest (ROIs), each of the middle two groups (i.e., with presumed medium level of dopamine signaling) showed significantly lower ReHo than each of the other two groups (i.e., low or high level of dopamine signaling; p < 0.05). Details on additional significant contrasts are available from the authors.

