Figure 5.

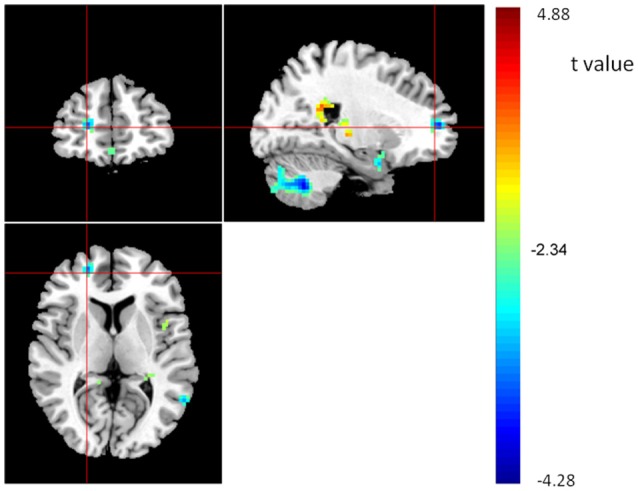
Brain areas showing positive (red) or negative (blue) correlations with WM, based on whole brain ReHo analysis, with AlphaSim correction (p < 0.01; N = 298). The coordinates of the cross are [22, 50, 7].

Brain areas showing positive (red) or negative (blue) correlations with WM, based on whole brain ReHo analysis, with AlphaSim correction (p < 0.01; N = 298). The coordinates of the cross are [22, 50, 7].