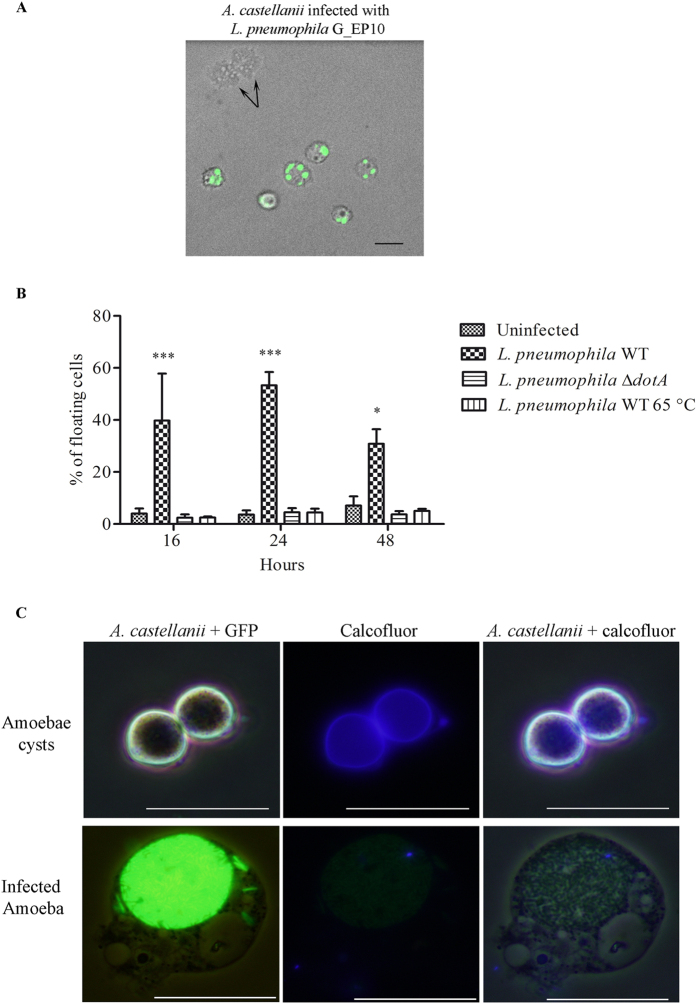
Figure 3. L. pneumophila modifies the shape of A. castellanii.
(A) A. castellanii ATCC 30010 were infected with L. pneumophila Paris expressing GFP (G_EP10) at a MOI of 20. Green color represents the GFP signal. Images were captured 18 h post-infection. Black arrows show cell division of one mother cell into two daughter cells. The size bar represents 20 μm. (B) A. castellanii ATCC 30010 were infected with wild type (WT) L. pneumophila Paris, heat-killed and ∆dotA L. pneumophila Paris at a MOI of 20. At different time points, the percentage of floating cells was estimated. Results are average of three independents experiments and errors bars represent the standard error of the mean (±SEM). The asterisks indicate data that are significantly different compared to uninfected cells (*p < 0.05, ***p < 0.001). (C) A. castellanii ATCC 30010 were cultured in encystation medium or infected with L. pneumophila Paris G_EP10 at MOI of 20. Twenty-four hours after treatment or infection, cells were harvested and stained with calcofluor in order to reveal cyst forms. Transmitted light, green and blue channels represented respectively amoebae, GFP (L. pneumophila) and calcofluor (cellulose) signals. The size bar represents 20 μm.

