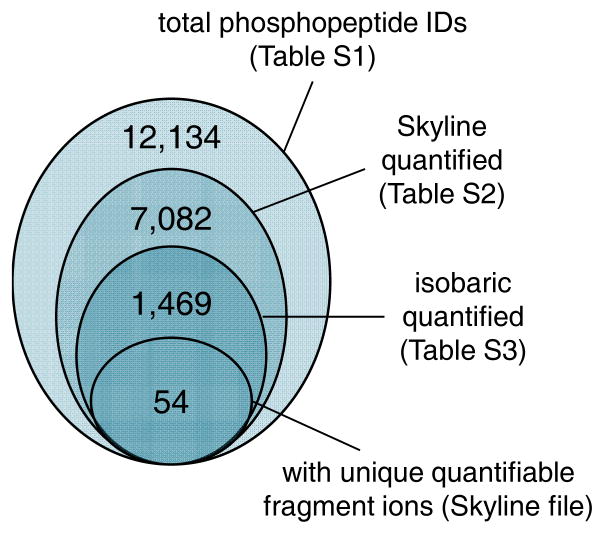
Figure 1. Numbers of characterized phosphopeptides.
Large circle, DDA identified phosphopeptides using Proteome Discoverer (Thermo). Second circle, number of quantified using Skyline confidence threshold. Third circle, number of isobaric phosphopeptides present in the Skyline result table. Small circle, differentially quantified isobaric phosphopeptides in this study.

