
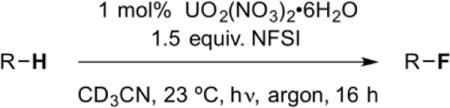
Table 3.
Fluorination of Oxygenated Molecules
| |||
|---|---|---|---|
| Entry | substrate | product | Yield [%][a] |
| 1 |
|
n/a | No fluorination |
| 2 |
|
|
Trace |
| 3 |
|
|
Trace |
| 4 |
|
|
Trace |
| 5 |
|
|
Trace |
| 6 |
|
n/a | No fluorination |
| 7 |
|
n/a | No fluorination |
| 8 |
|
|
Trace |
| 9 |
|
|
13 |
| 10 |
|
|
10 |
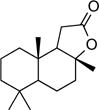
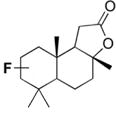
| 11 |
|
|
26[b] |
| 12 |
|
n/a | No fluorination |
| 13 |
|
n/a | No fluorination |
| 14 |

|
n/a | No fluorination |
[a]
Yield determined by NMR through integration relative to a methyl acetate internal standard;
[b]
1.6:1 C2/C3 fluorination