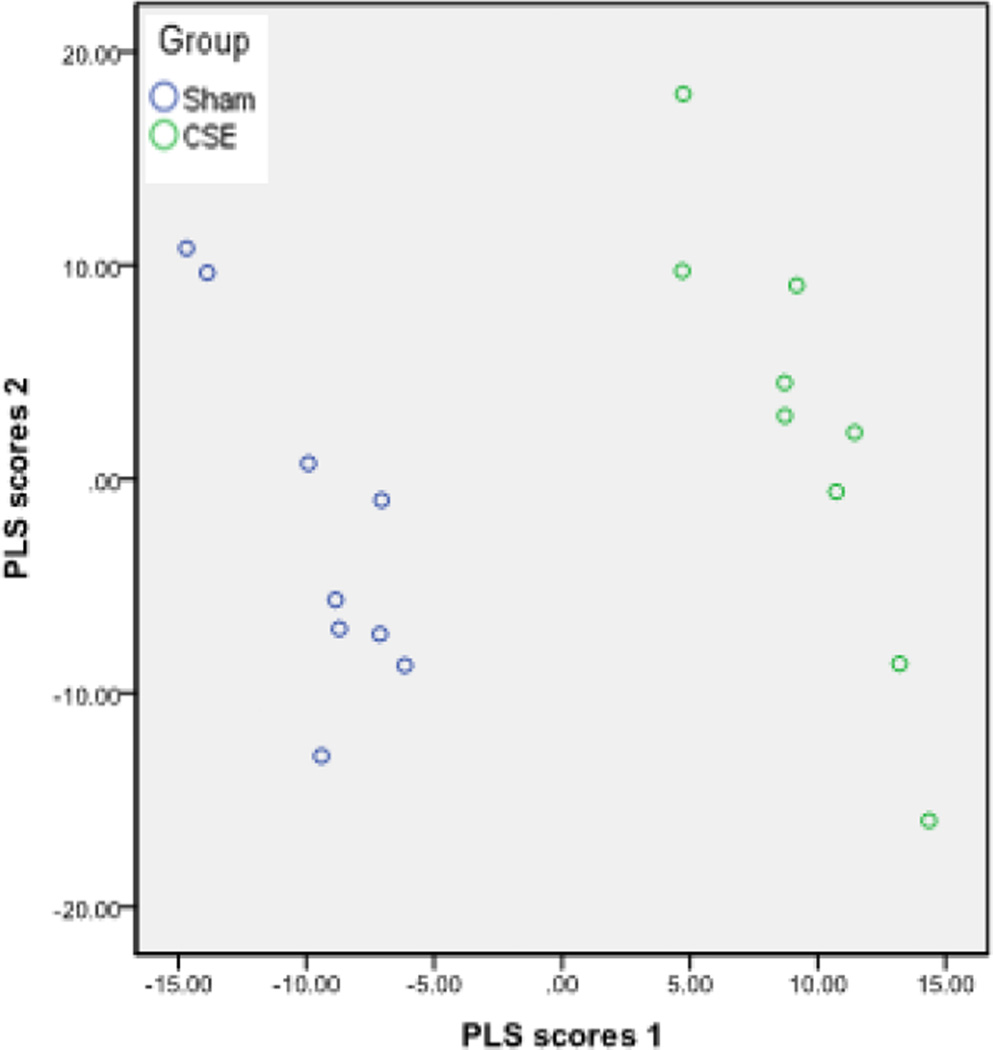
Figure 2. The PLS-DA model effectively describes the differences between the hippocampus proteome profiles of Sham and developmental CSE offspring at 6 months of age.
Plotting the first two vectors within the PLS-DA model visualizes the variance in hippocampus proteome profiles between the developmental CSE and Sham groups. Each circle represents a single sample subjected to 2D-SDS-PAGE.

