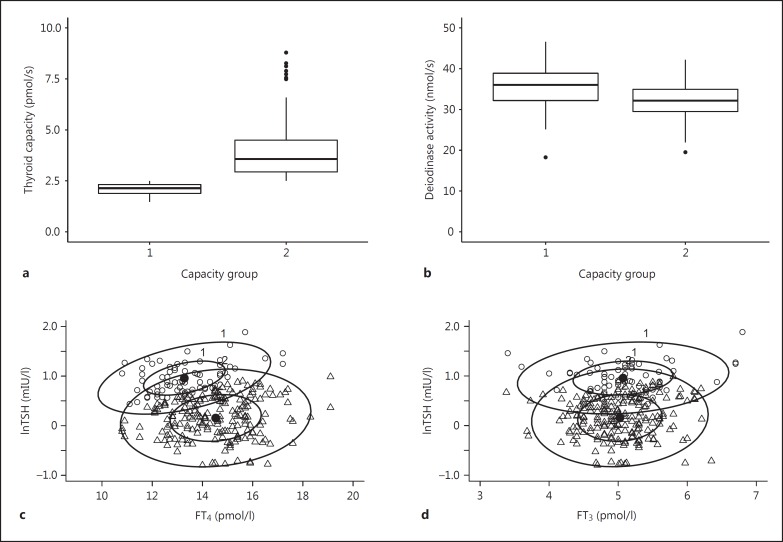
Fig. 3.
Thyroid capacity (a), deiodinase activity (b), confidence ellipses at 50% plus 95% of the bivariate distribution of FT4 and logarithmic TSH (c), and FT3 and logarithmic TSH (d) in controls with relatively low (n = 71) versus high (n = 197) thyroid capacity. The upper panel shows the opposing behavior of thyroid capacity and deiodinase activity. The lower panel shows a change in the lnTSH-FT4 relationship, accompanied by a FT4 shift but stable FT3 positions between the capacity groups (cutoff 2.5 pmol/s).

