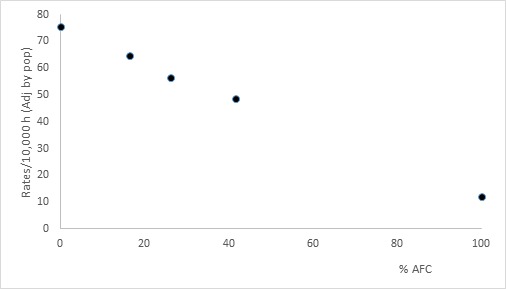
Figure 2. Dengue cumulative incidence according to % populations AfroColombian. Cali, 2013. Pearson correlation was -0.99 (CI 95%= -0.98 - -1.0). Dots indicated the dengue cumulative incidence by levels of proportions of populations of Afro-Colombians; left dot is the dengue incidence for only Non-Afro-Colombians, next dot is the dengue incidence for low proportions of populations of Afro-Colombians; central dot is the dengue incidence for Cali population; next dot is the dengue cumulative incidence for high proportion of Afro-Colombians; right dot is the dengue cumulative incidence for only population Afro-Colombians.

