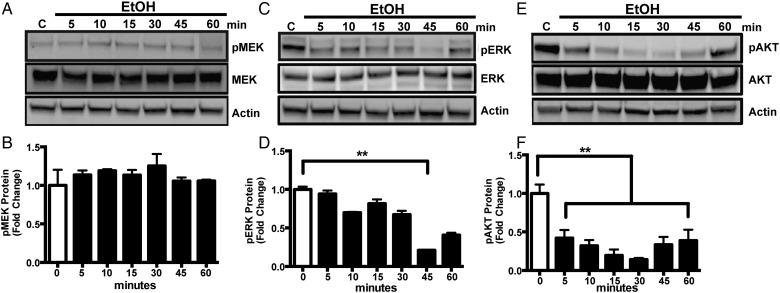
Fig. 1.
Alcohol decreases pERK and pAKT in microglial cells. (A, C and E) Representative immunoblot images of pMEK and MEK, pERK and ERK or pAKT and AKT proteins in whole cell lysates from ESdM cells treated with alcohol (100 mM) for 5–60 min, subjected to western blot analysis and probed with anti-pMEK, anti-MEK, or anti-pERK, anti-ERK or, anti-pAKT, anti-AKT, and then anti-β-actin antibody. (B, D and F) Graphical representation of fold change ratio of pMEK, pERK, and pAKT to total MEK, ERK, and AKT, respectively, normalized to β-actin loading control ± SEM. Results are expressed as the ratio of phosphorylated MEK, ERK or AKT to their respective total proteins, normalized to the internal standard actin. Note: actin was used as a loading control. Data were analyzed by one-way ANOVA; data points represent the mean ± SEM (n = 3), *P < 0.05, **P < 0.01, ***P < 0.002.

