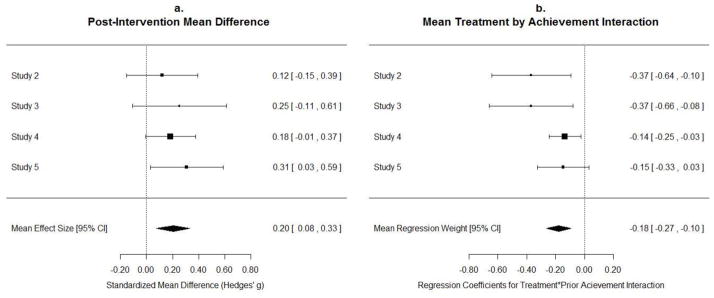
Figure 6.
On average, across Studies 2–5, mean achievement scores were 0.20 standard deviations higher in the treatment conditions than control conditions at post-intervention (Panel a). Additionally, the weighted mean coefficient for the Treatment X Prior achievement interaction was significantly different than 0 (Panel b).

