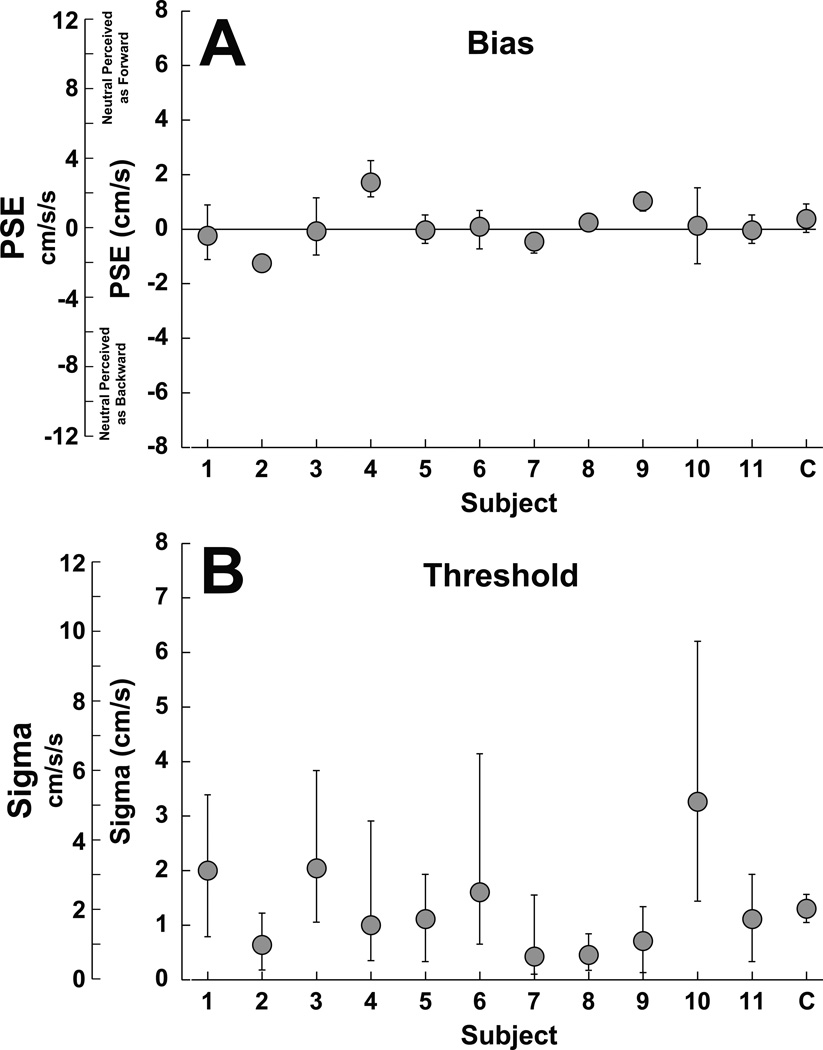
Figure 3.
Fore-aft perception with no tilt (NT). The furthest right column on each panel (labeled C) represents fits from all data combined across subjects. Panel A represents the bias which was near zero in most subjects. Error bars represent the 95% confidence interval (CI) of the PSE. Data were combined by fitting a psychometric function to the data points from all subjects. Panel B represents the threshold (sigma). For individual subjects error bars represent the mean ± 95% CI. The combined data is the mean ± SE of the individual values.

