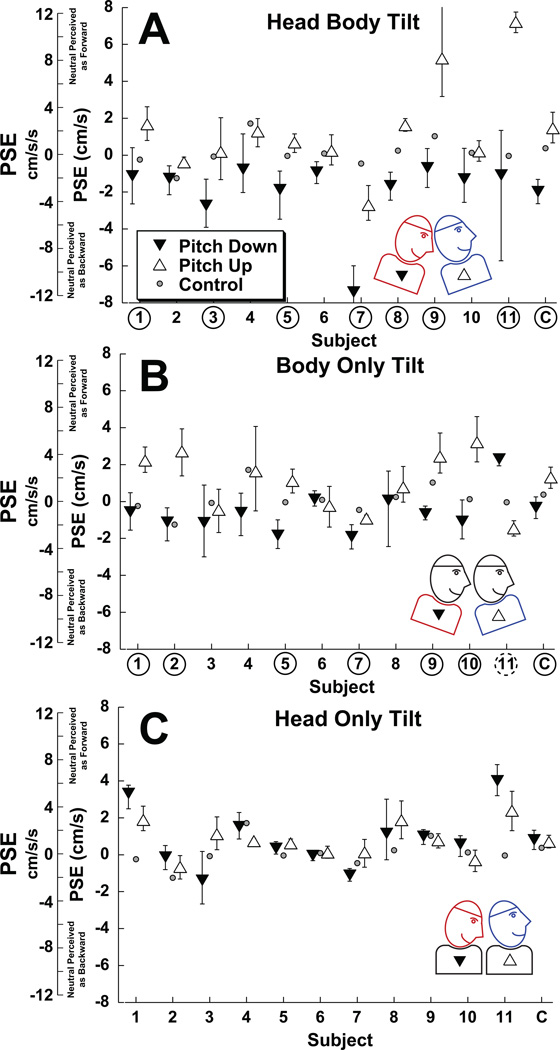
Figure 4.
The effect of head and body tilt on bias of fore-aft translation perception. In each panel filled downward pointing arrows represent 10° pitch down and open upward pointing arrows represent 10° pitch up. The error bars represent the 95% confidence interval of the PSE. The furthest right column on each panel (labeled C) represents fits performed on all the data combined across subjects. For individual subjects in which upward pitch caused a significant (p < 0.01) forward bias relative to downward pitch the subject number is circled with a solid line. For conditions in which the bias was significant in the opposite direction, the subject number is circled with a dashed line. Small gray circles represent the bias in the NT condition (also shown in Fig. 3A). The scale on the left includes both the peak velocity and peak acceleration of the stimulus. Panel A: Head body tilt (HBT). In every instance the pitch up tilt created a forward bias relative to the pitch down condition. Panel B: Body only tilt (BOT). In all but one subject (#11) the pitch up tilt led to a forward bias relative to the pitch down condition. Panel C: Head only tilt (HOT). No significant bias based on tilt direction were found.

