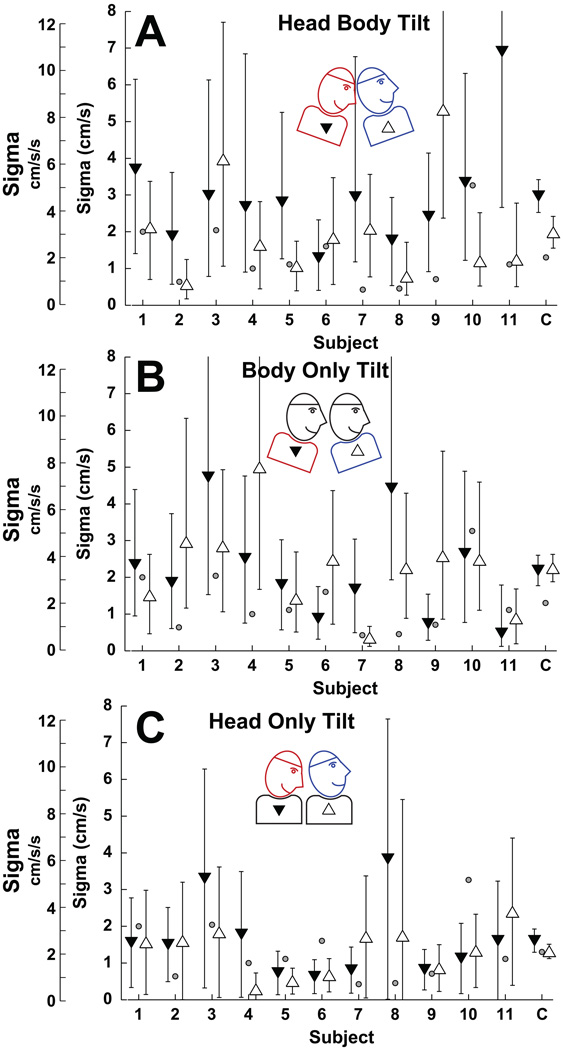
Figure 5.
The effect of head and body tilt on fore-aft translation thresholds. Filled downward pointing triangles represent pitch down and open upright triangles represent pitch up. For individual subjects error bars represent the 95% CI. Combined data (labeled C) is the mean ± SE across subjects. Small gray circles represent the threshold in the NT condition (also shown in Fig. 3B). The scale on the left includes both the peak velocity and peak acceleration.

