Figure 2.

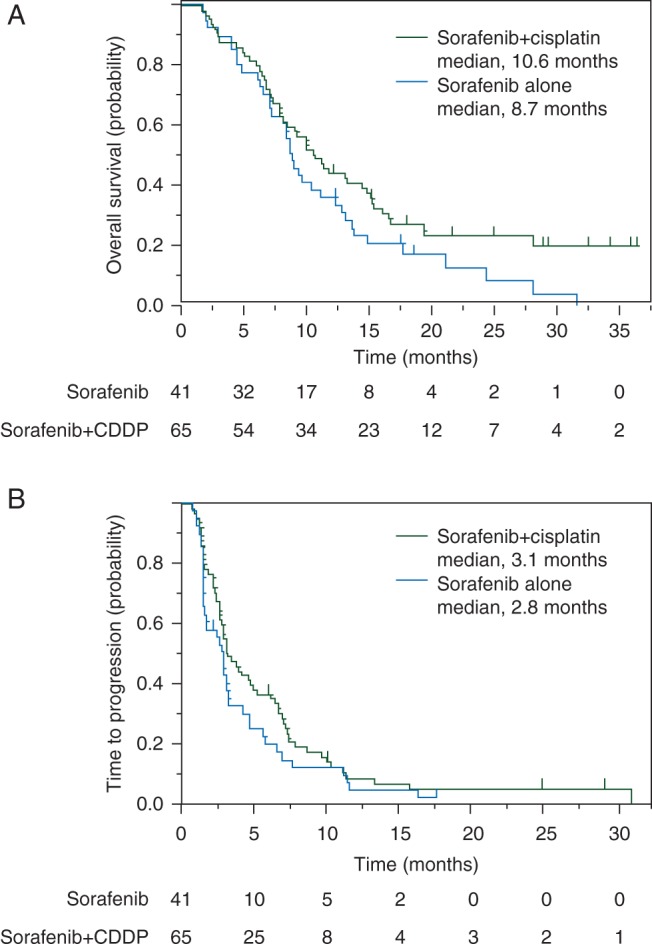
Kaplan–Meier curves of overall survival (A) and time to progression (B) in the sorafenib arm (blue line) and sorafenib plus hepatic arterial infusion chemotherapy with cisplatin arm (green line). The tick marks indicate censored cases.

Kaplan–Meier curves of overall survival (A) and time to progression (B) in the sorafenib arm (blue line) and sorafenib plus hepatic arterial infusion chemotherapy with cisplatin arm (green line). The tick marks indicate censored cases.